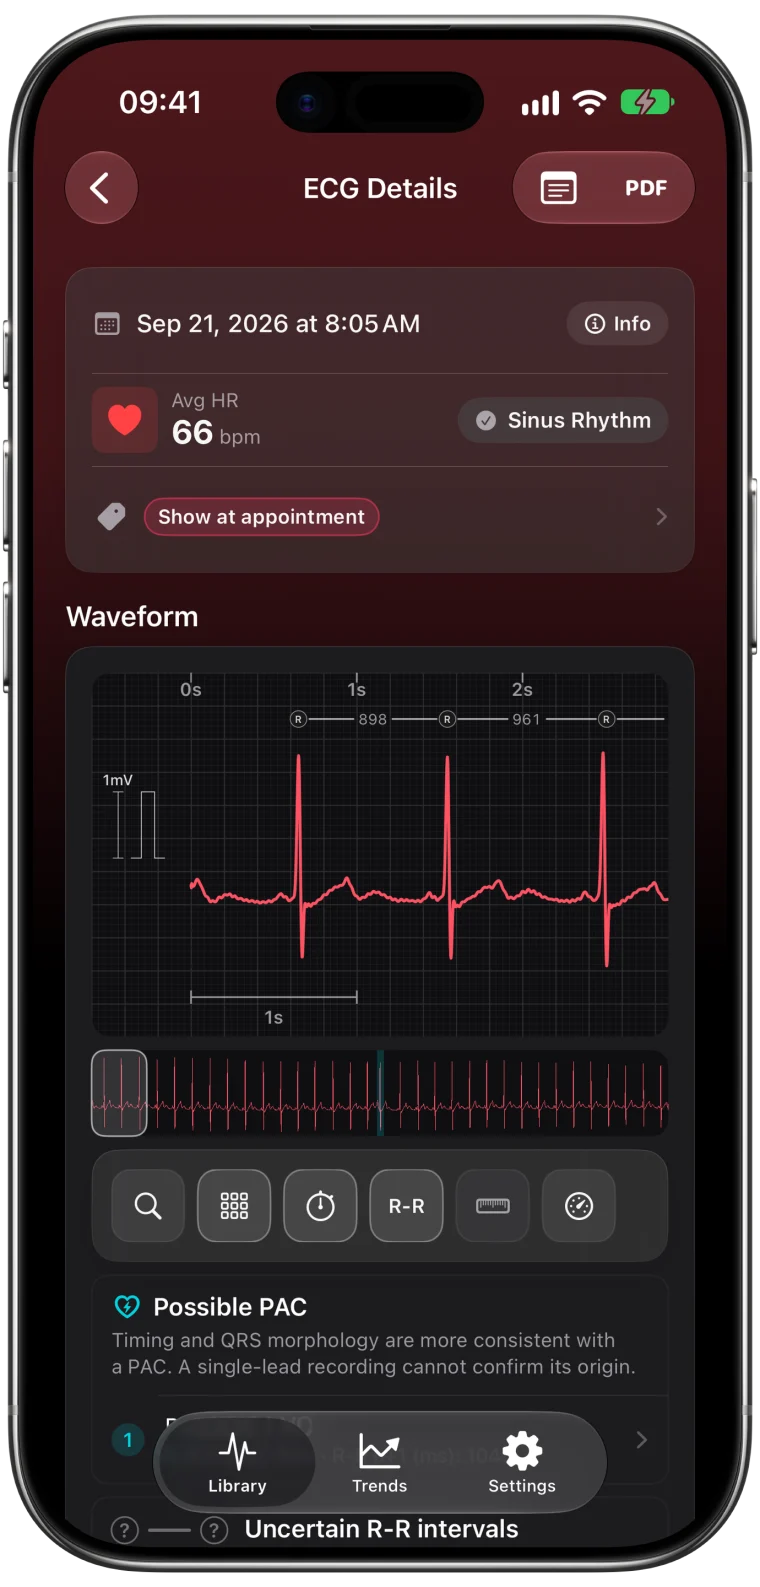
A 30-second strip is great for rhythm, but each beat is tiny. To see the small P wave, the sharp QRS and the slower T wave clearly, you need to zoom in on one heartbeat. That is what Beat Morphology does.
What you see in Beat Morphology
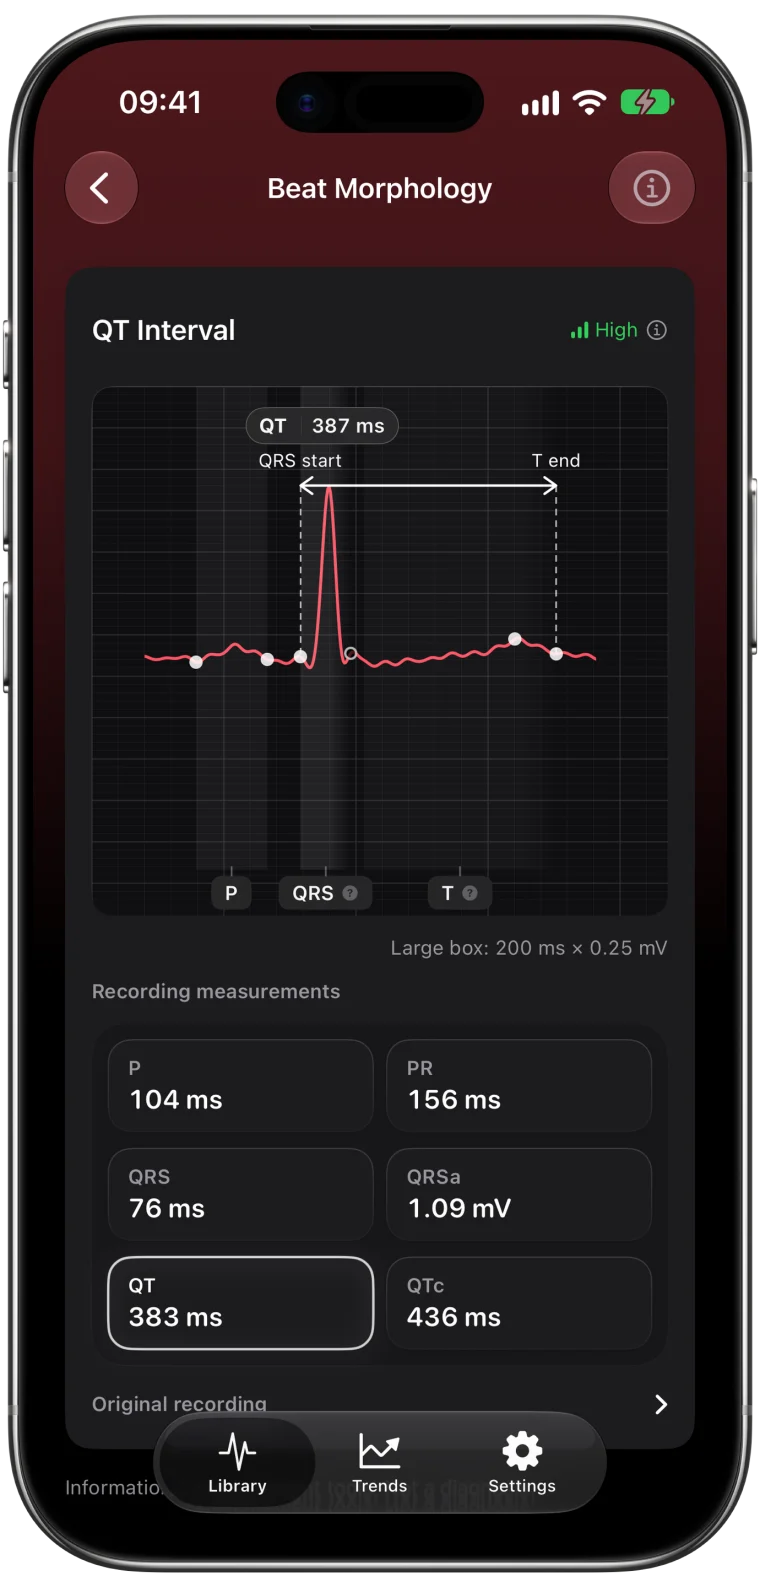
Open any ECG and tap Beat Morphology below the measurements. You see one heartbeat drawn large on a fine grid, with:
- P, QRS and T markers showing where each part of the beat was placed
- The interval you select, for example QT, drawn from its start to its end
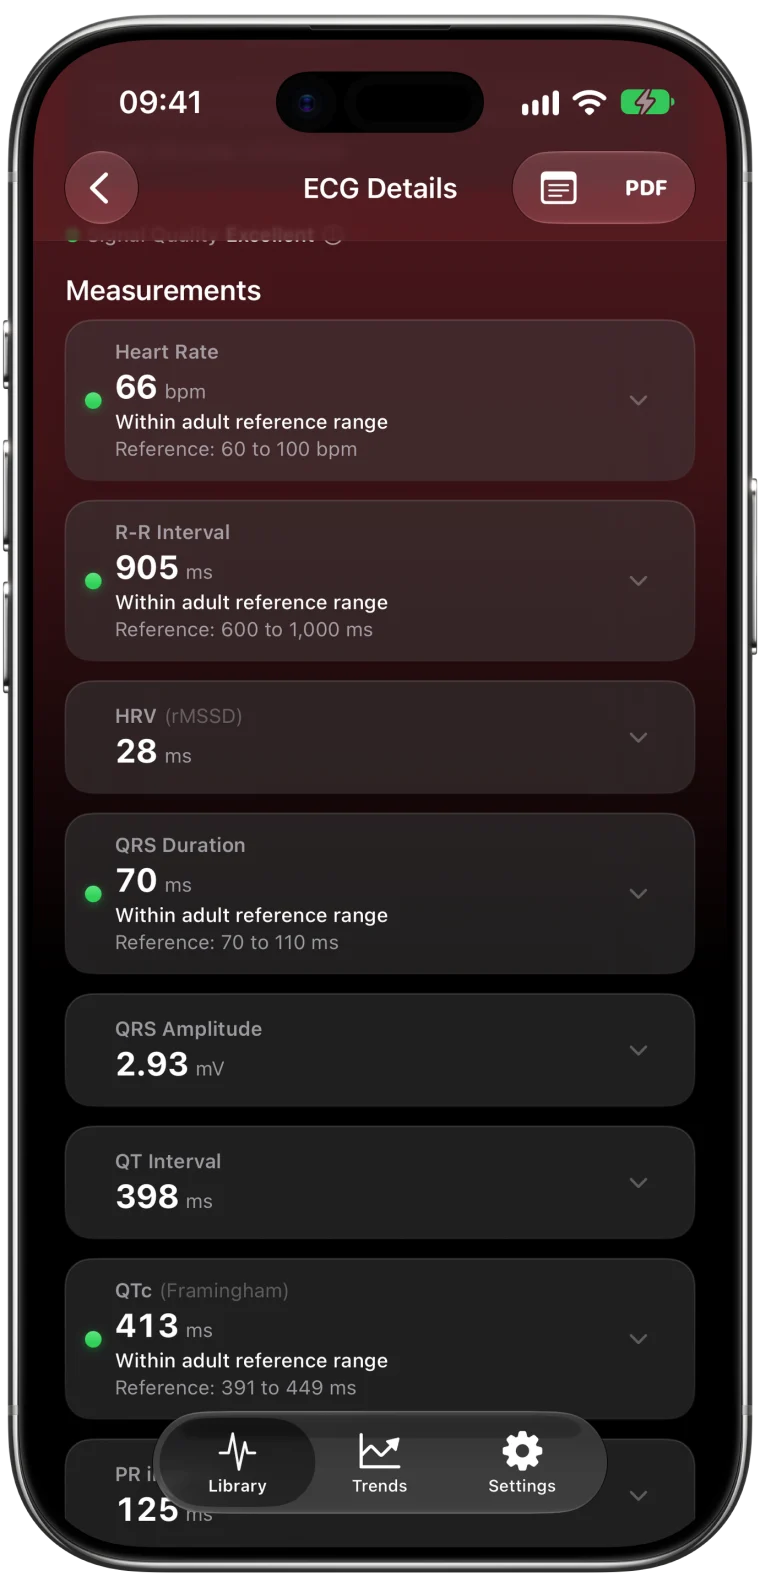
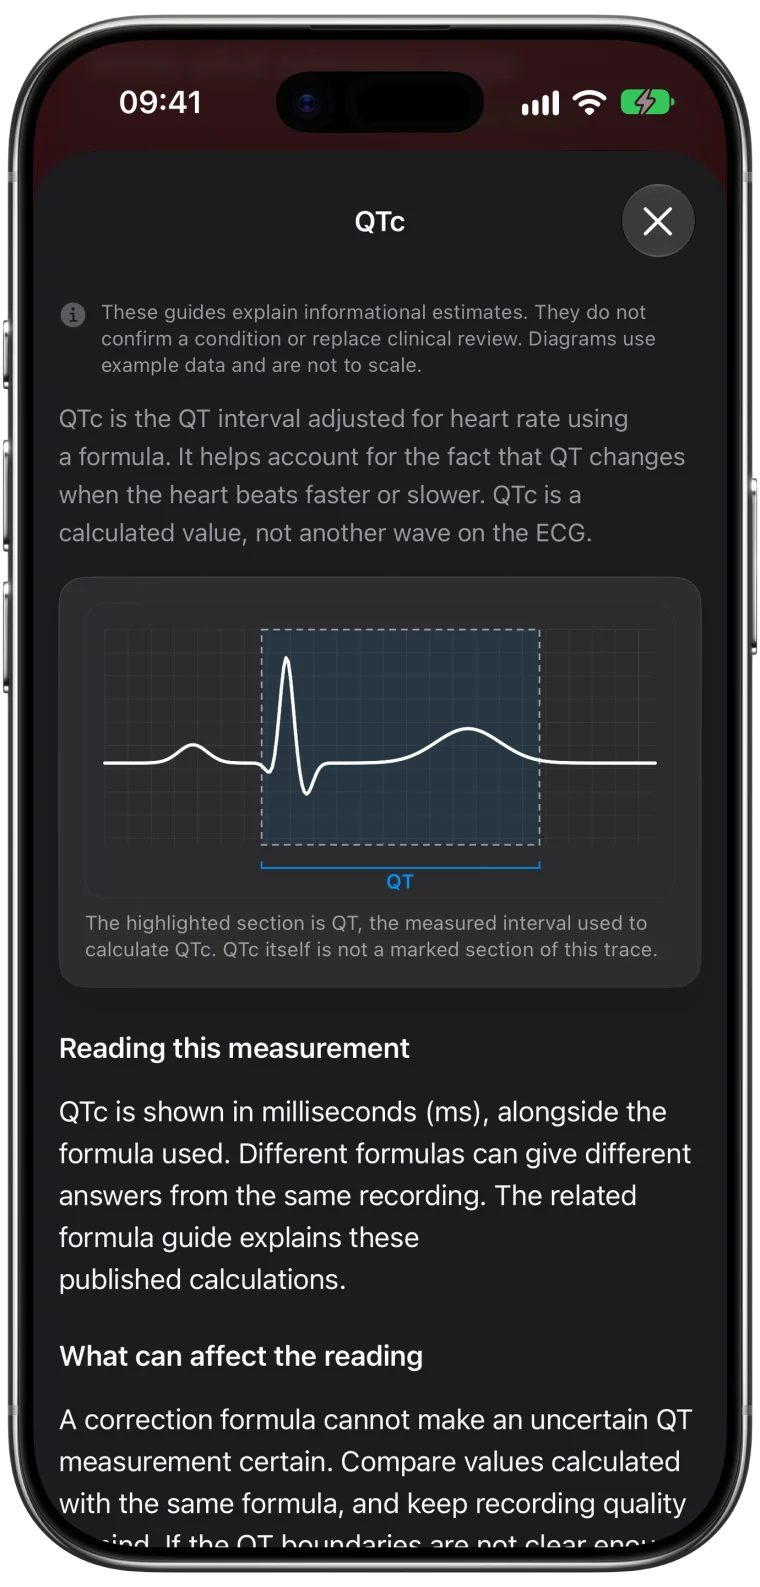
- Recording measurements below, such as P duration, PR, QRS, QRS amplitude, QT and QTc
The parts of one heartbeat
Every normal heartbeat on an ECG has the same sequence.1
- P wave. The upper chambers, the atria, are activated. It is small and rounded.
- PR segment. A short pause while the signal passes through the AV node.
- QRS complex. The lower chambers, the ventricles, are activated. It is tall and sharp because the ventricles are large.
- T wave. The ventricles recover and reset for the next beat. It is broader and slower.
On a single-lead Apple Watch ECG, all of these are usually visible, though the P and T waves can be small in some people.
One beat vs the whole recording
Beat Morphology shows a single beat, while the Measurements section describes the whole recording. The two numbers can differ slightly. In the example above, the focused beat's QT is 387 ms and the recording's QT is 383 ms. Both are estimates of the same ECG from different scopes, so a small difference is expected.
This is useful when a measurement looks surprising. Seeing exactly where the markers sit on a real beat helps you understand what the number represents.
Reading the markers
- If the T end marker sits where the T wave returns to the baseline, the QT span looks the way you would expect.
- If the P wave is very flat or hard to see, the PR interval and P duration may be less certain, or unavailable.
- A tall QRS amplitude usually reflects how the signal reaches the Watch, including your body build and arm position. It is not a diagnosis on its own.
The intervals guide explains typical adult ranges for each interval and what can affect them.
Frequently asked questions
Why does the QT in Beat Morphology differ from the Measurements value?
Beat Morphology shows one beat, while the Measurements value summarizes the whole recording. Small differences between the two are expected.
Can I see Beat Morphology for any ECG?
Beat Morphology is available for ECGs with enough clear beats to show a representative one. It is part of the full analysis, which you get with each of your three free analyses a month or with Pro.
Does Beat Morphology show extra beats?
It focuses on a typical beat. Possible extra beats are marked on the full waveform instead, where you can see their timing relative to the beats around them.