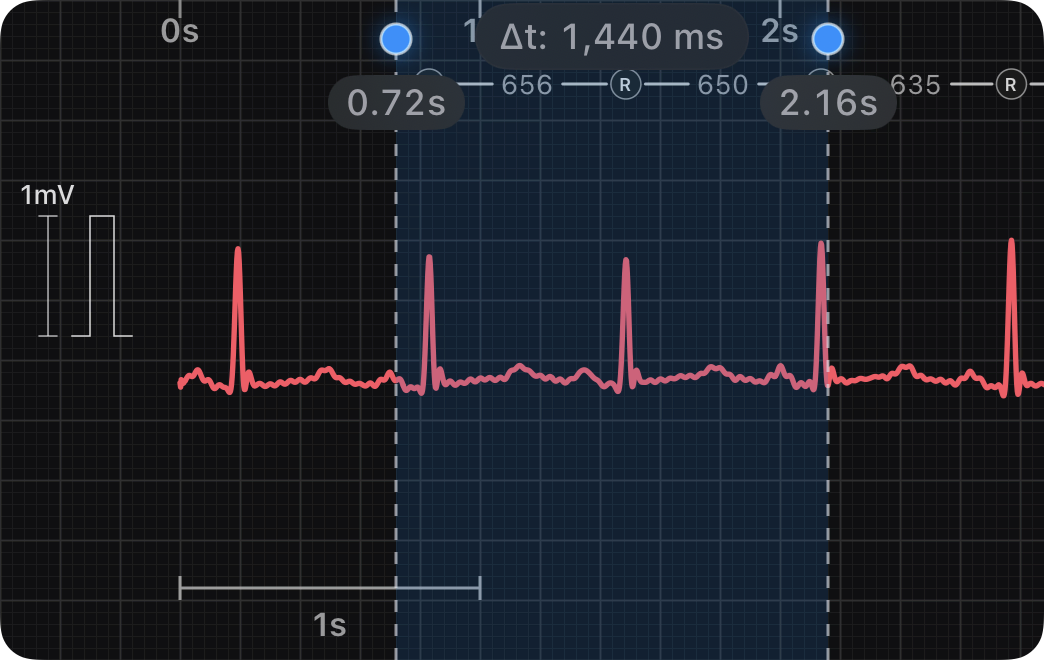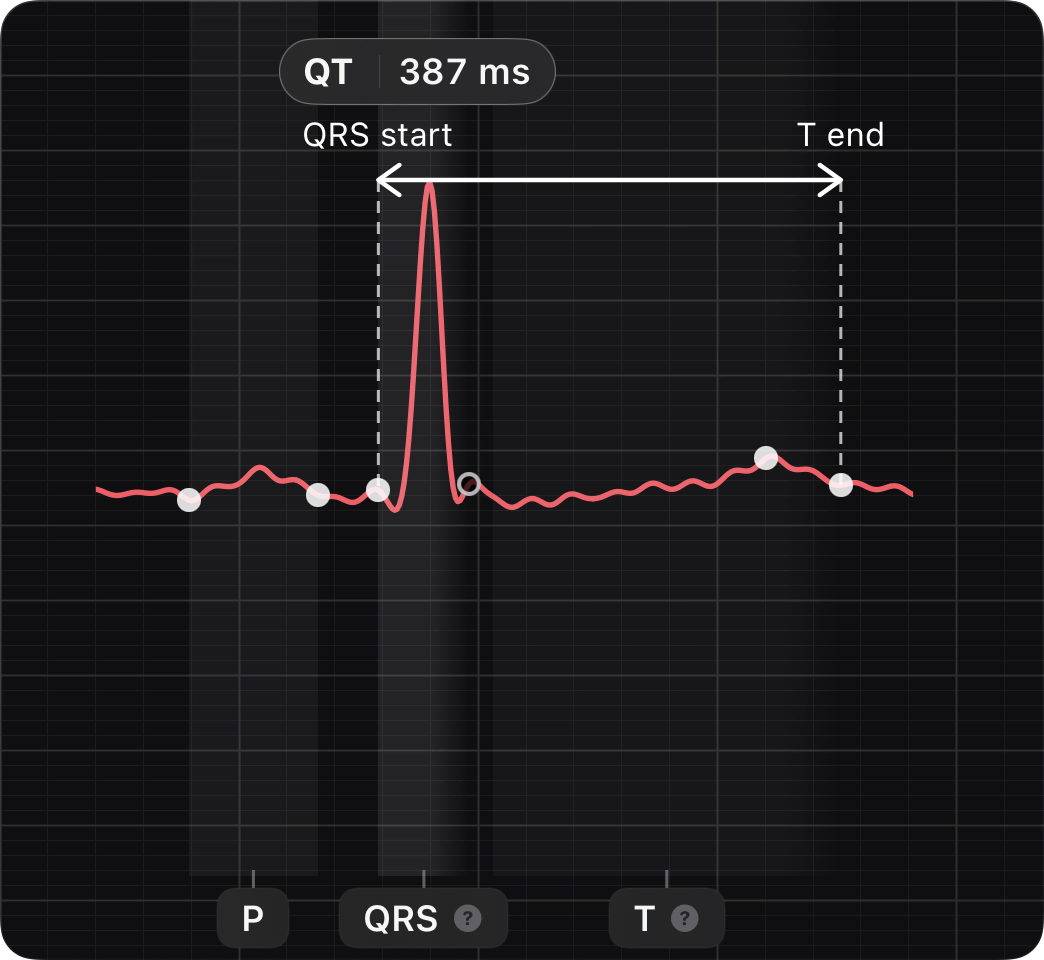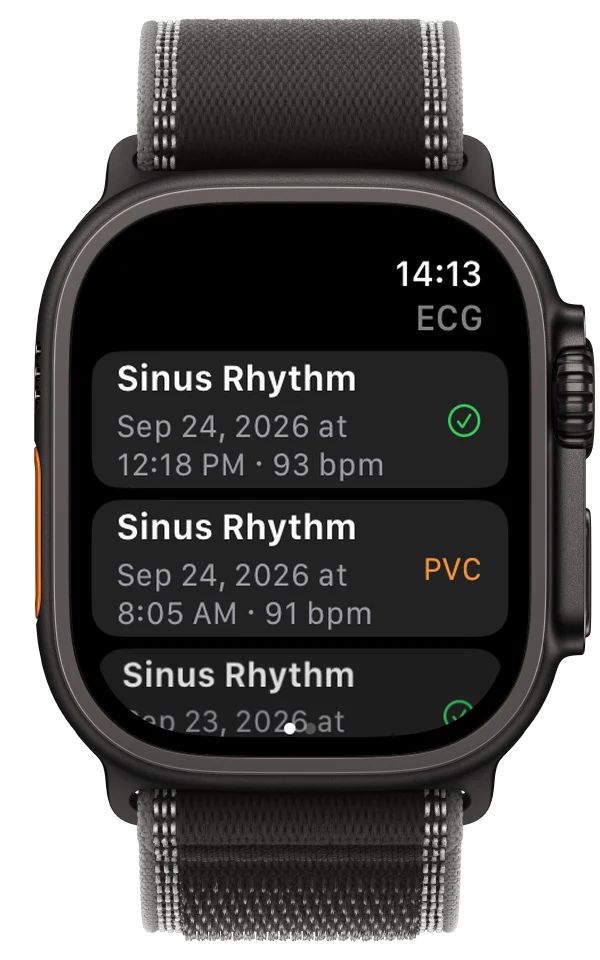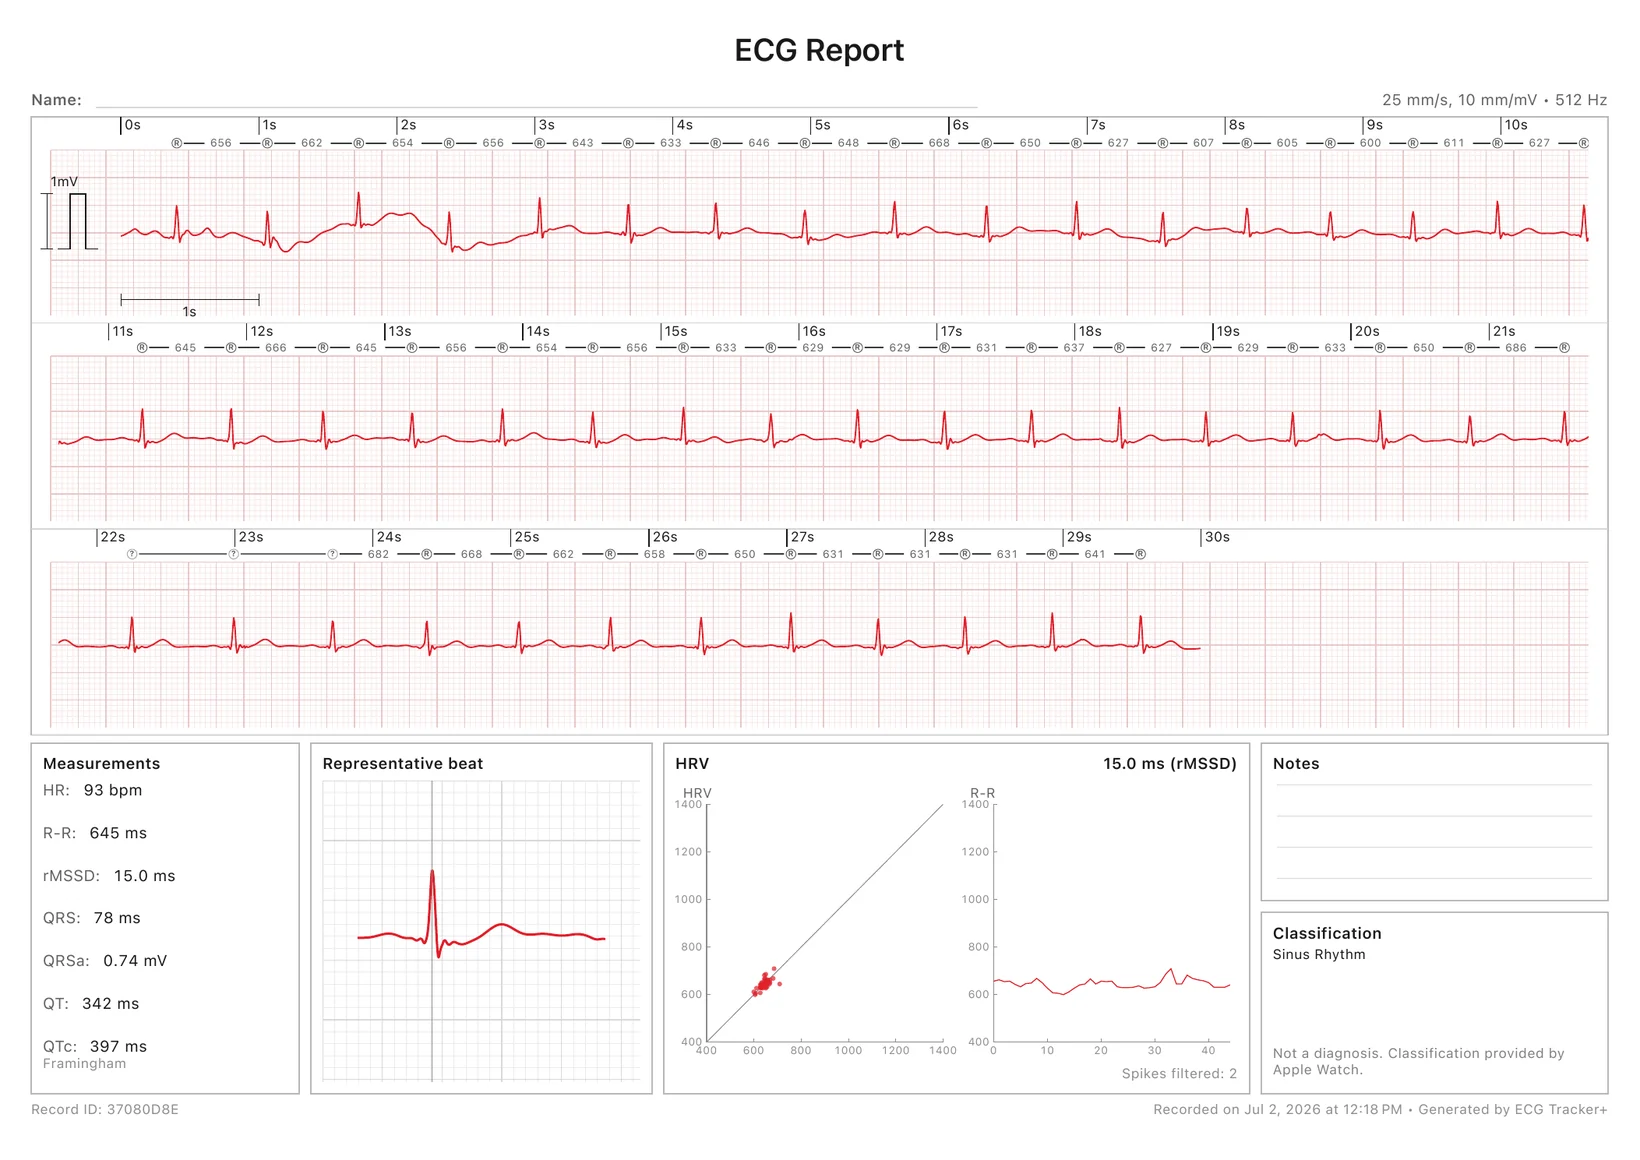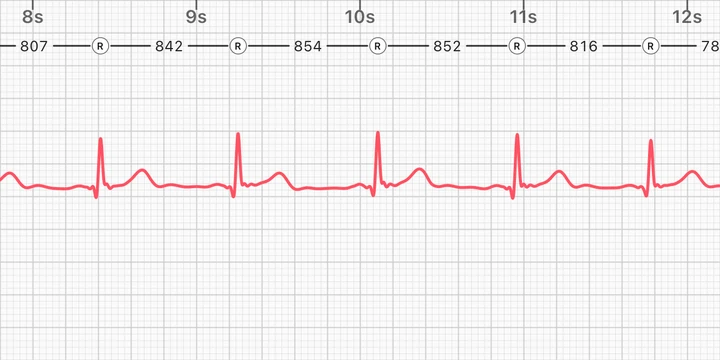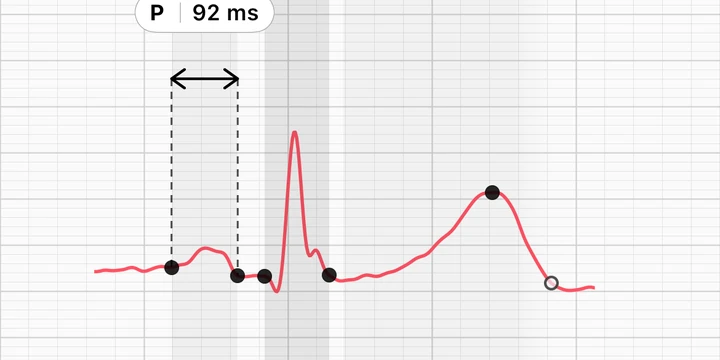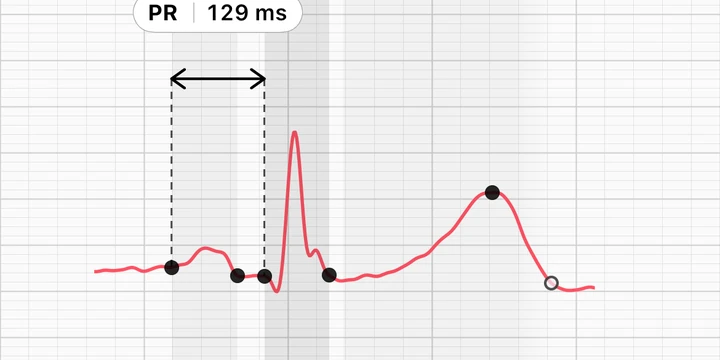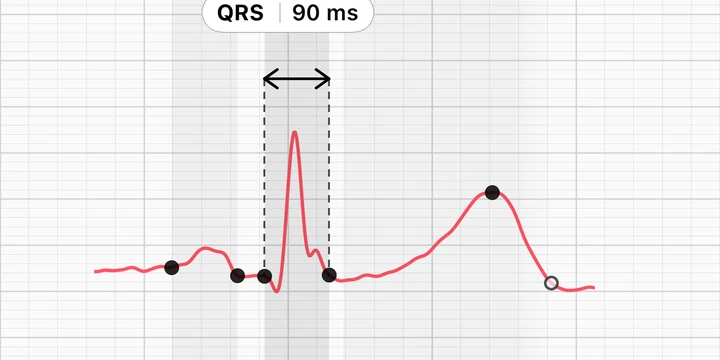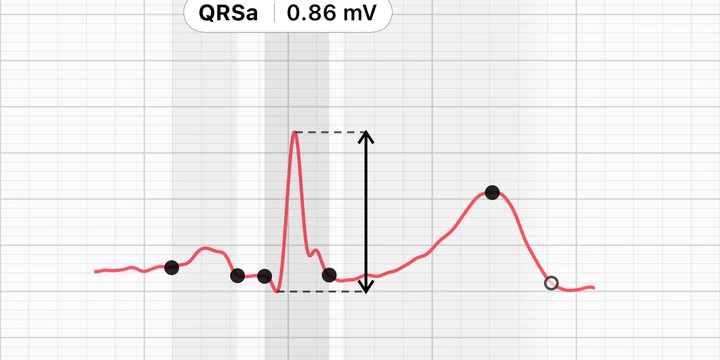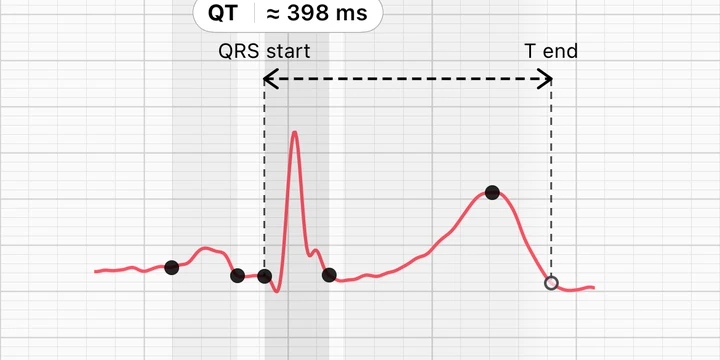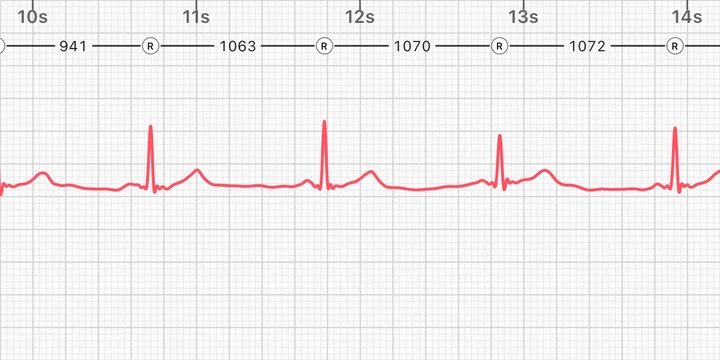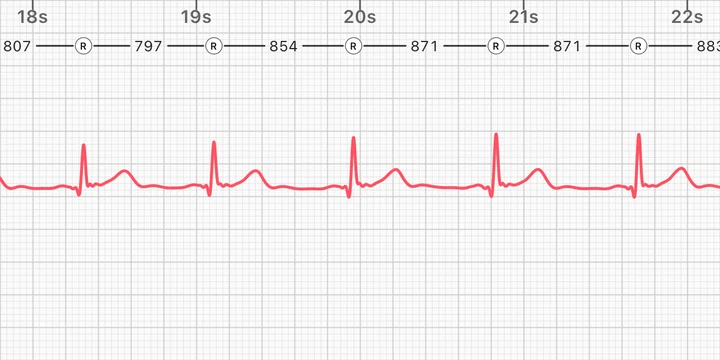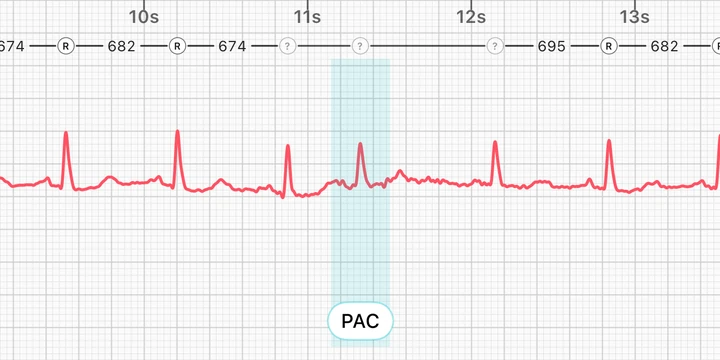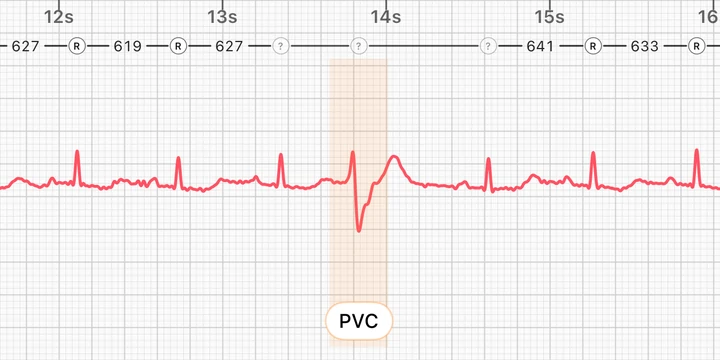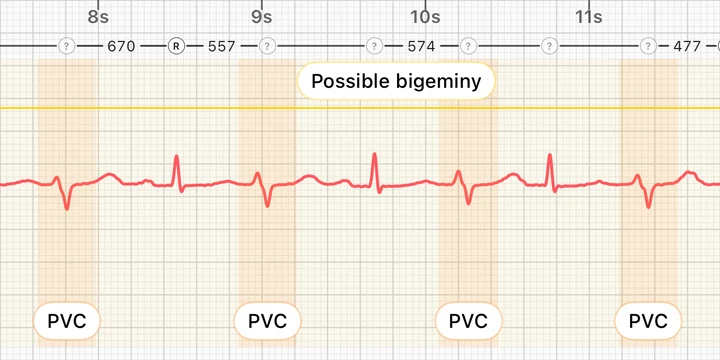
The intervals that matter.
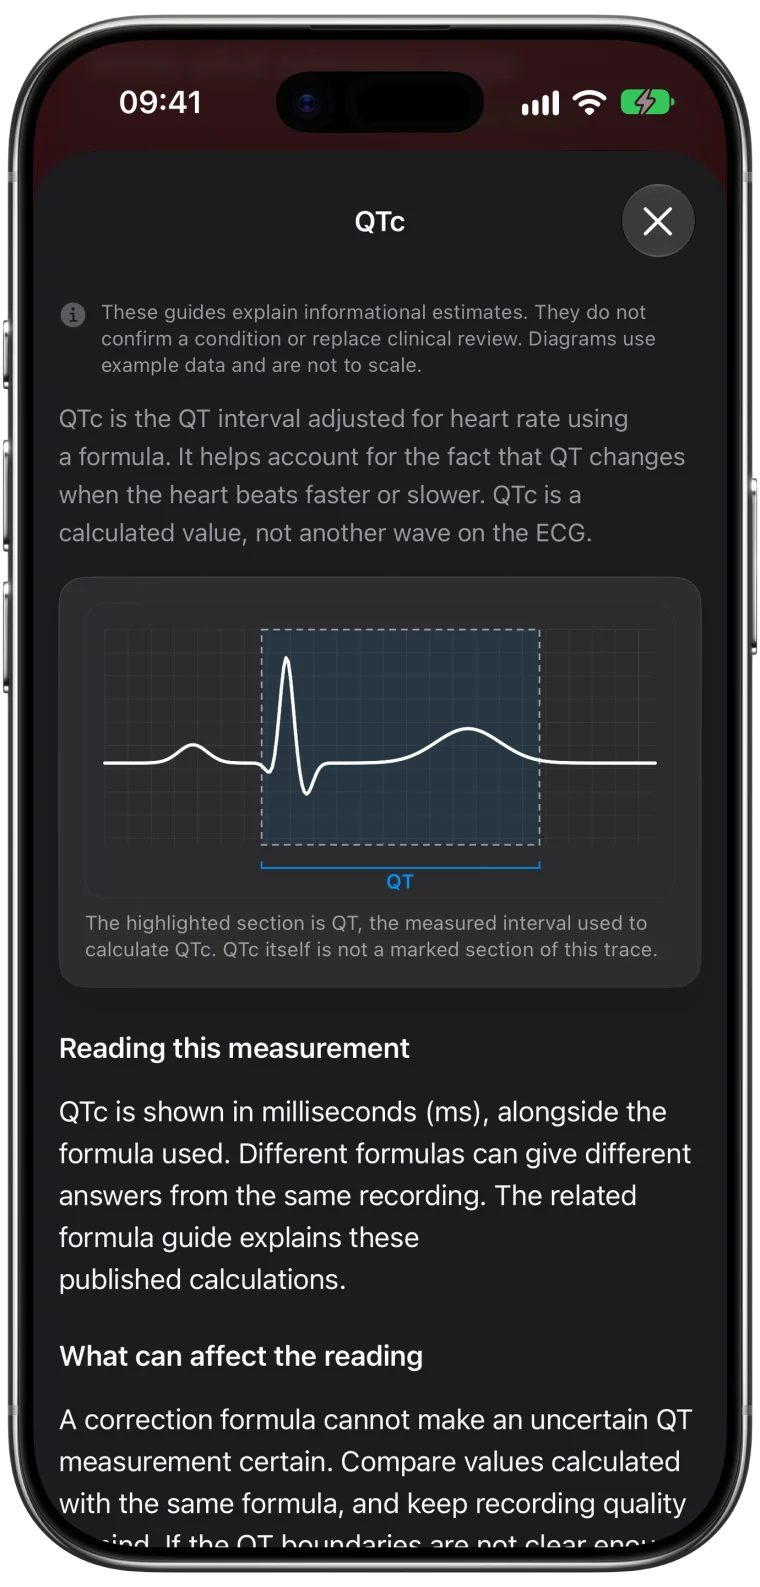
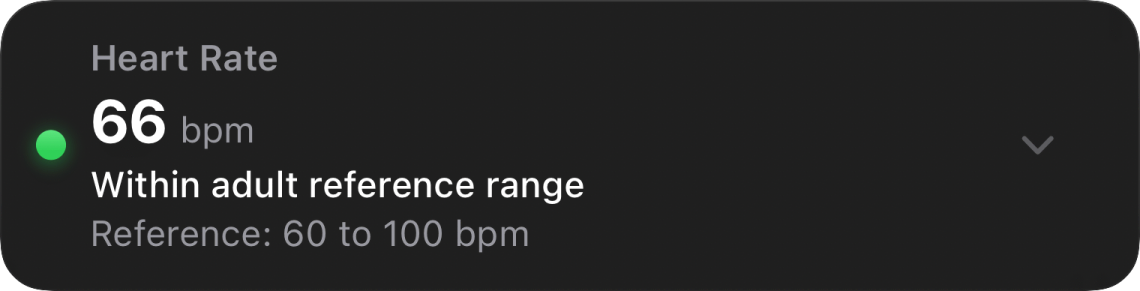
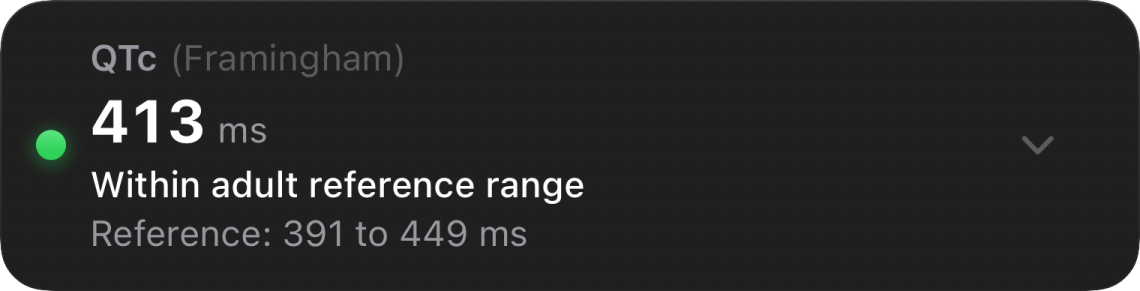
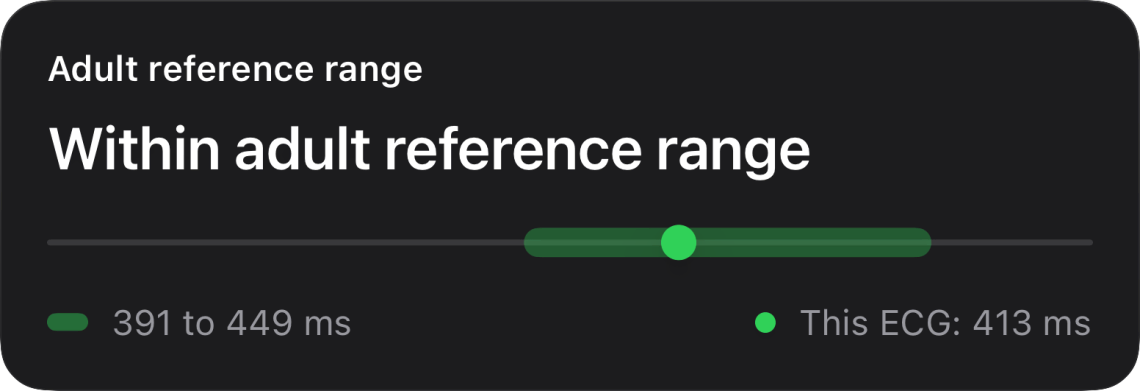
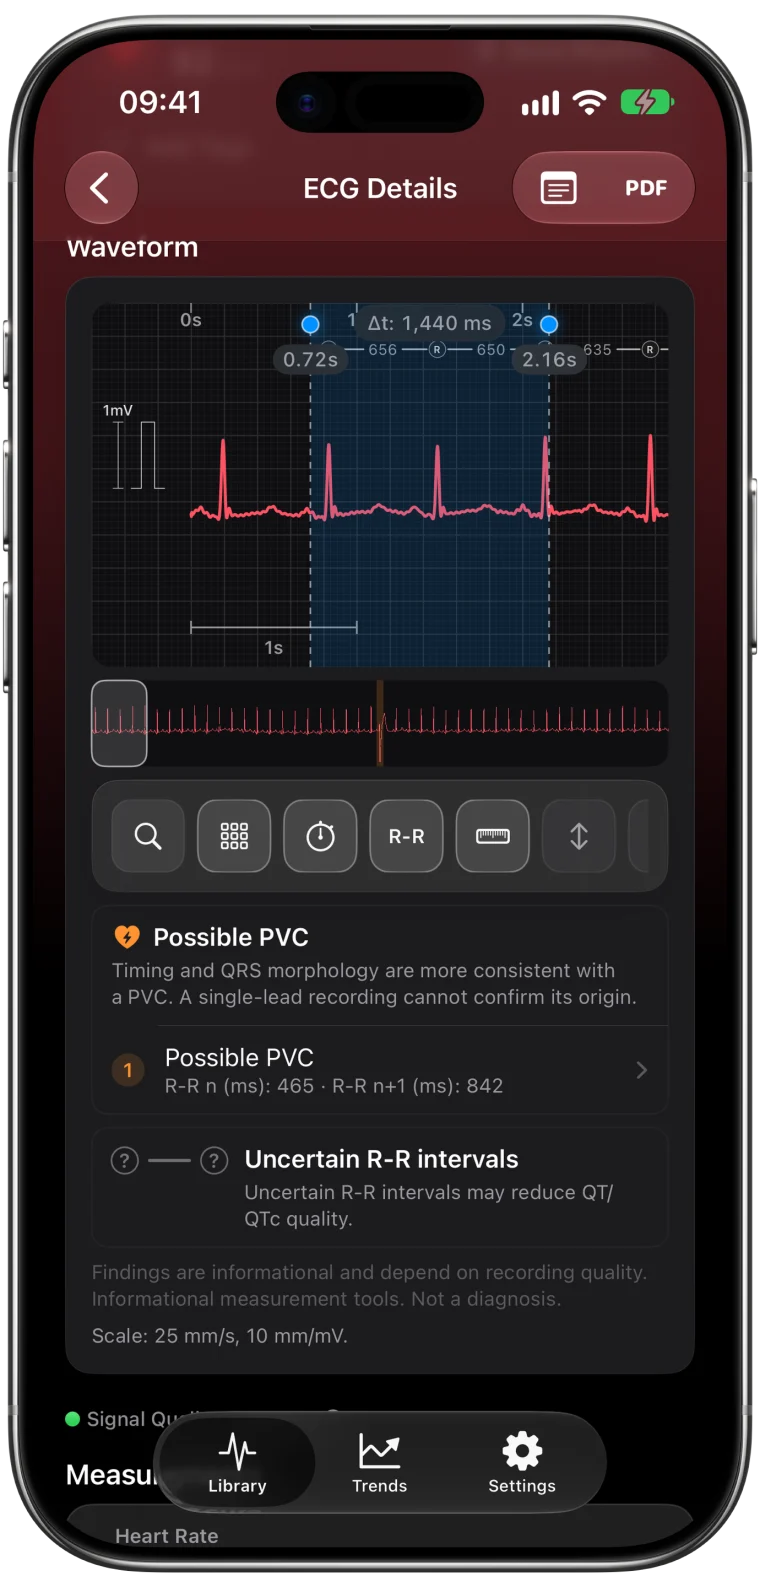
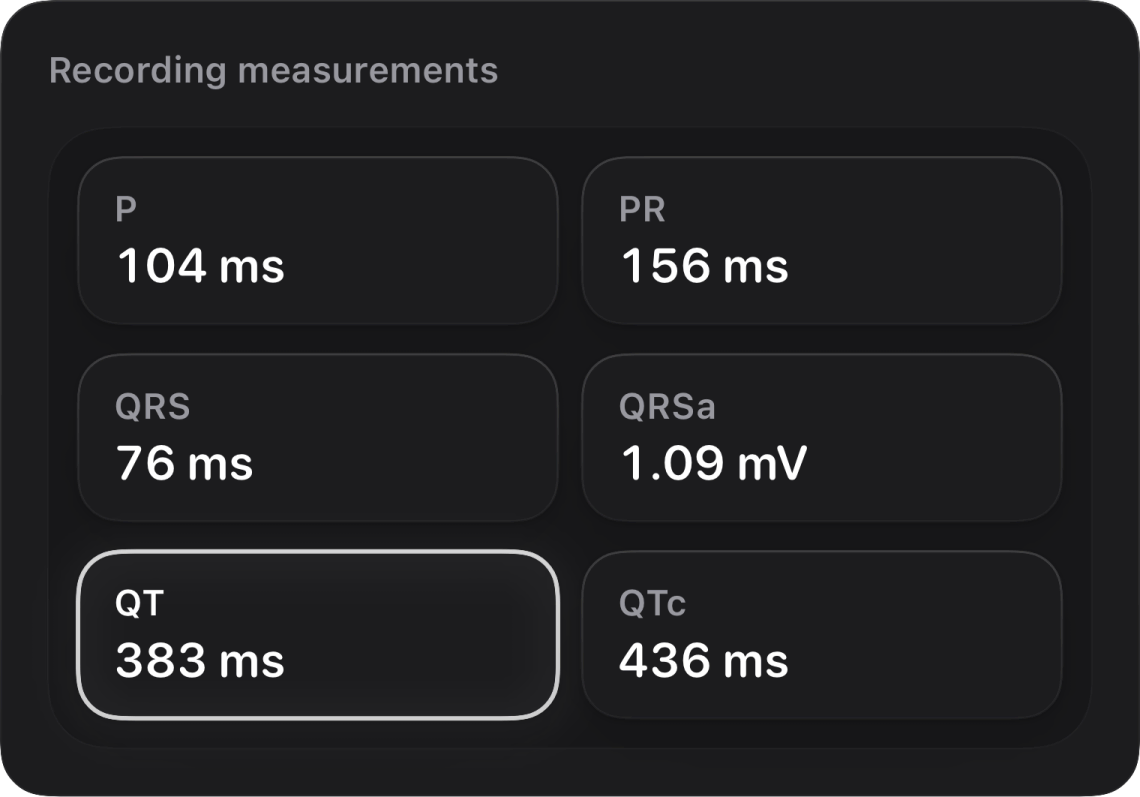
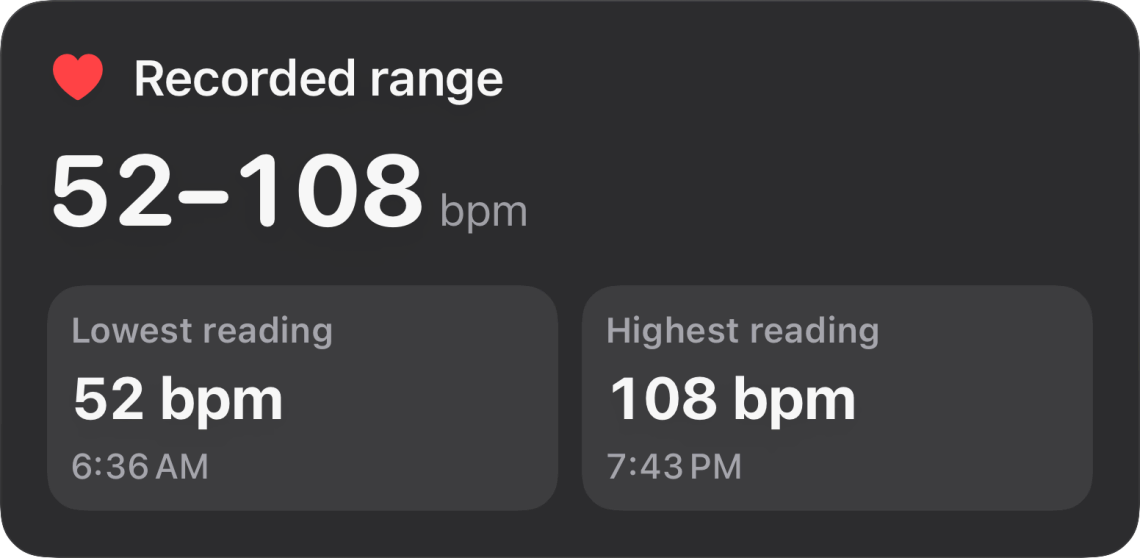
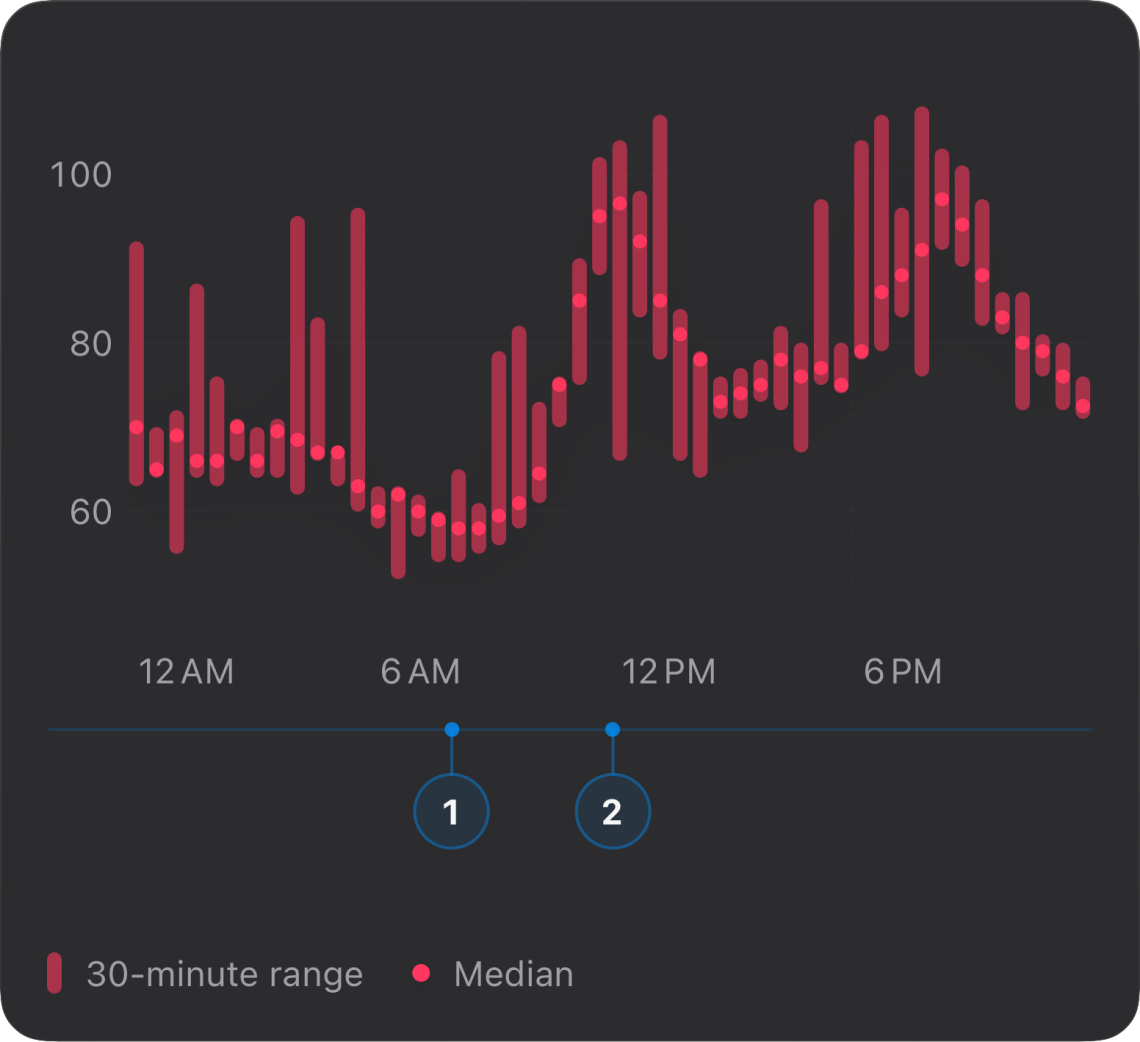
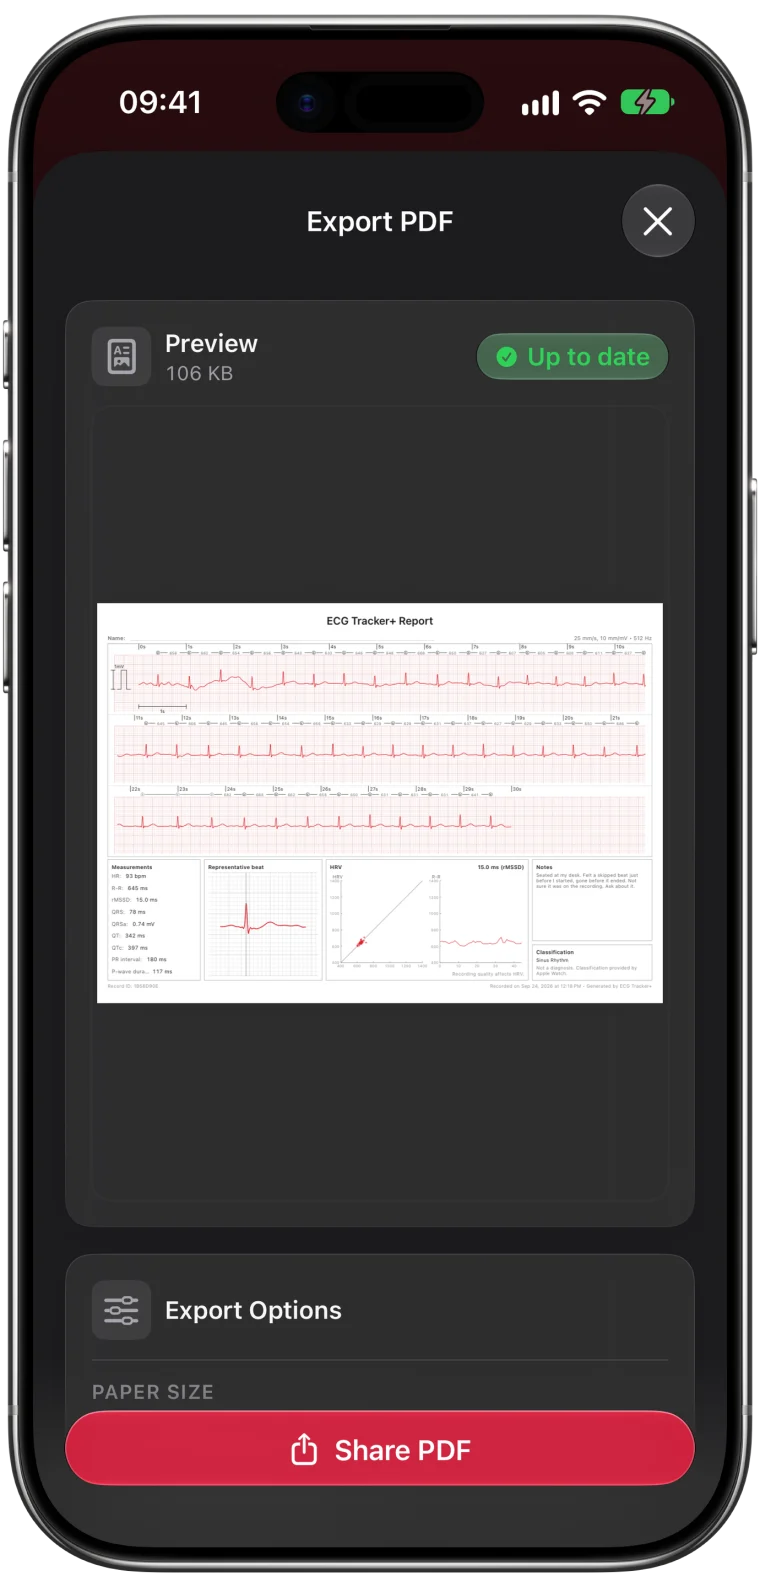
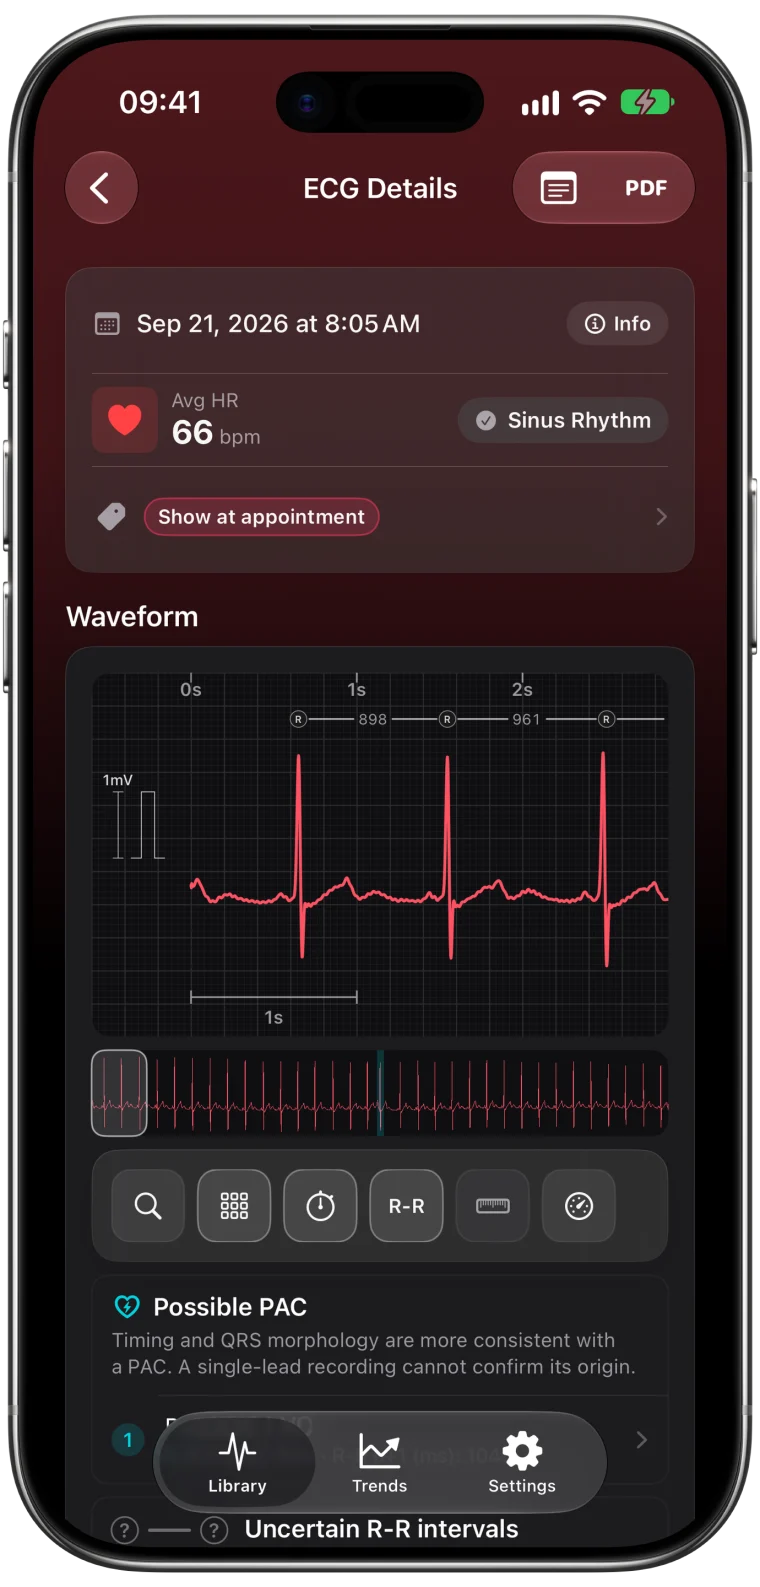
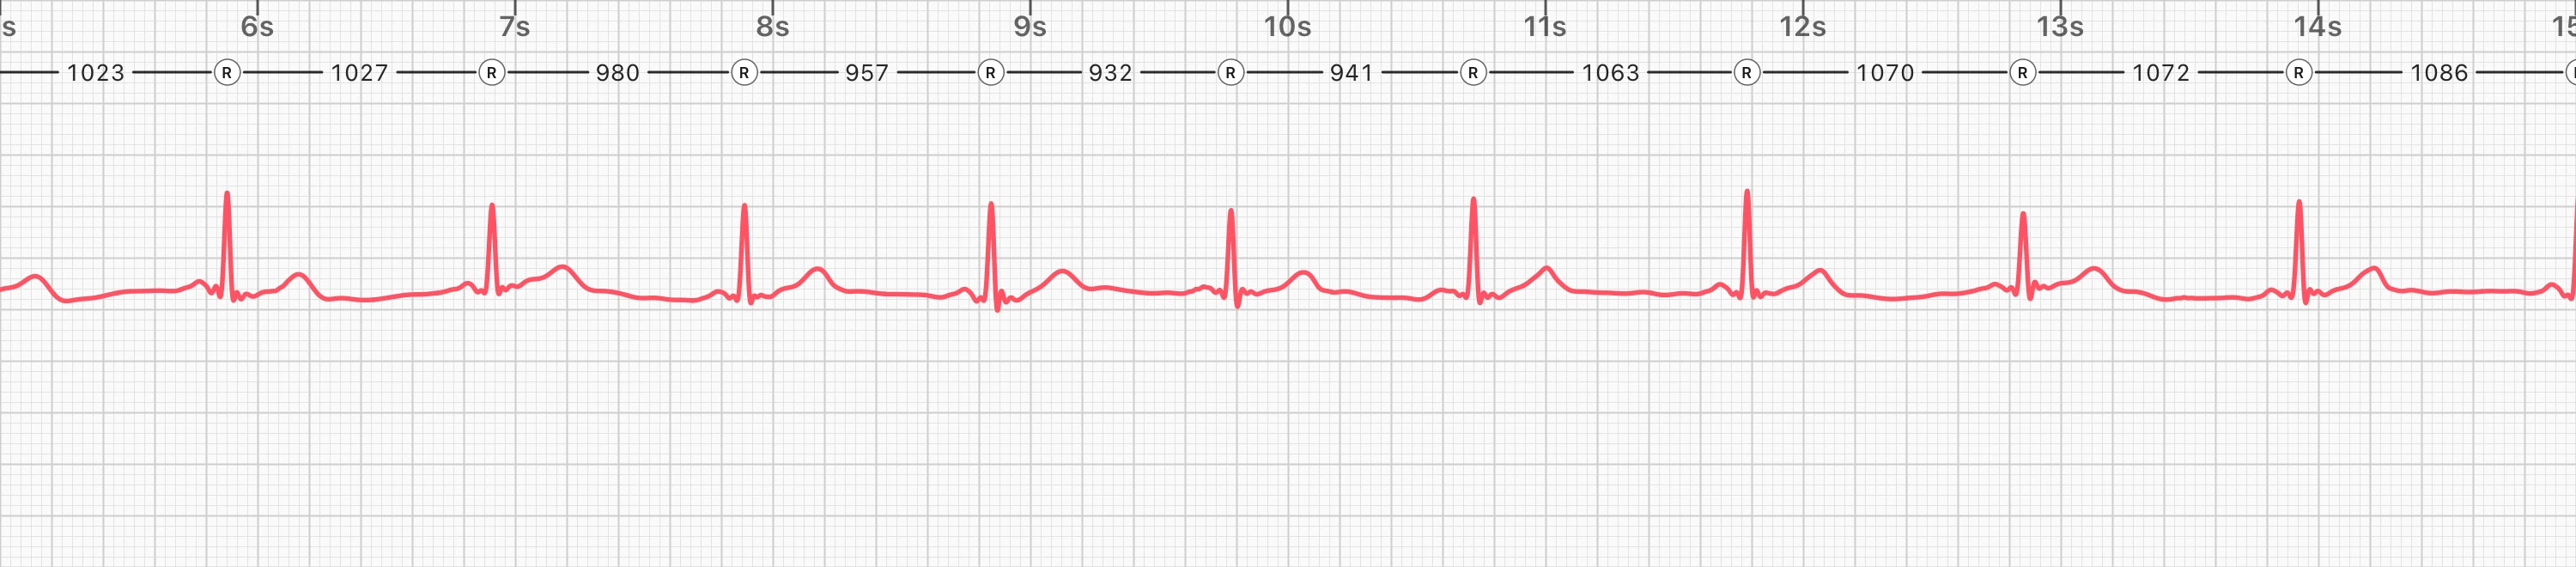
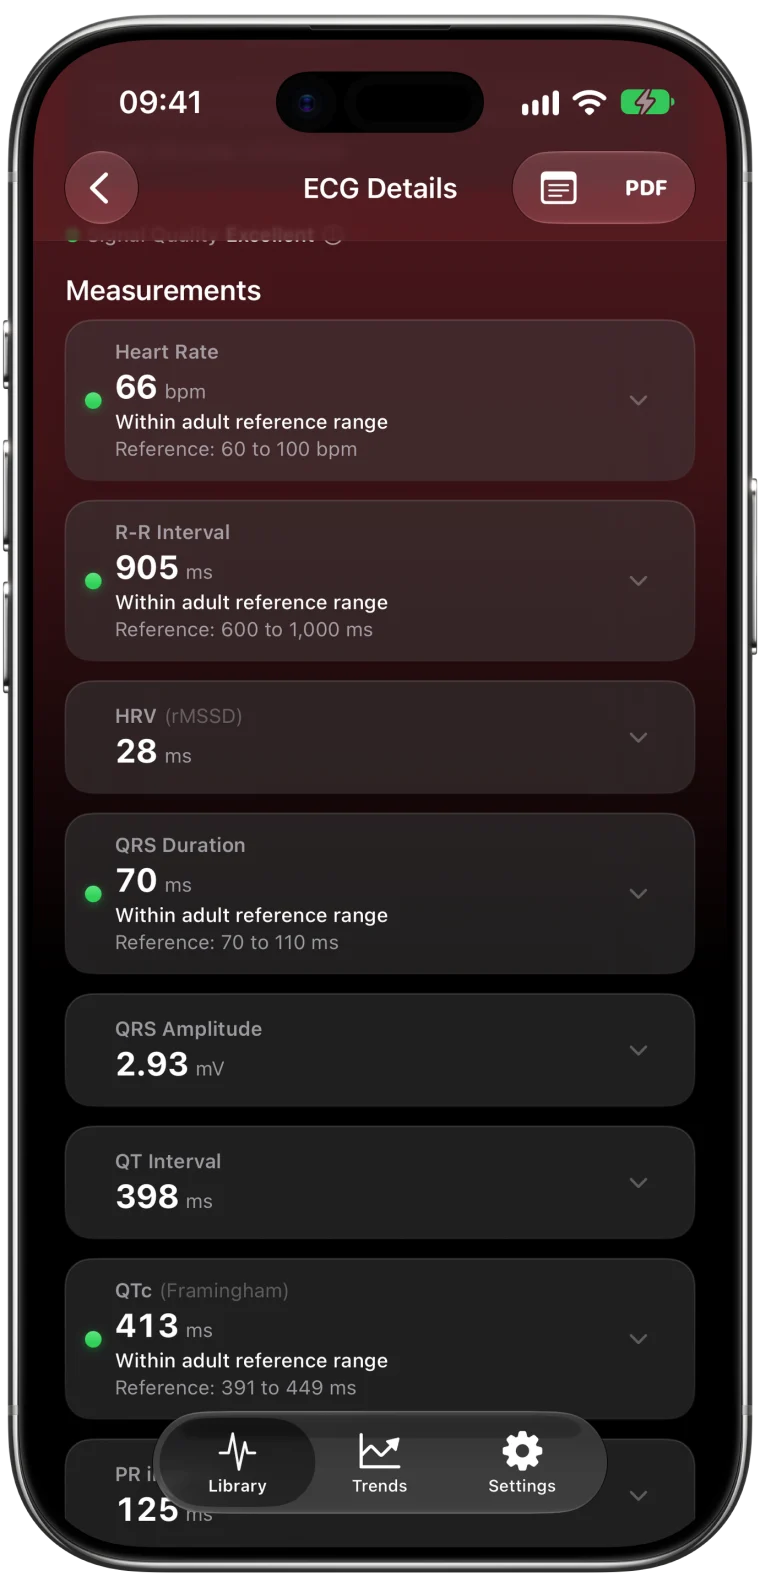
Heart rate, PR, QRS and QT/QTc estimates from an on-device model, paired with a signal-quality score that describes how usable the recording was.
- On-device QT/QTc estimates with signal-quality context
- Heart rate, PR, QRS and RR intervals
- HRV (rMSSD) with quality flags
The real Measurements screen · straight from the app
See your heartbeat's shape.
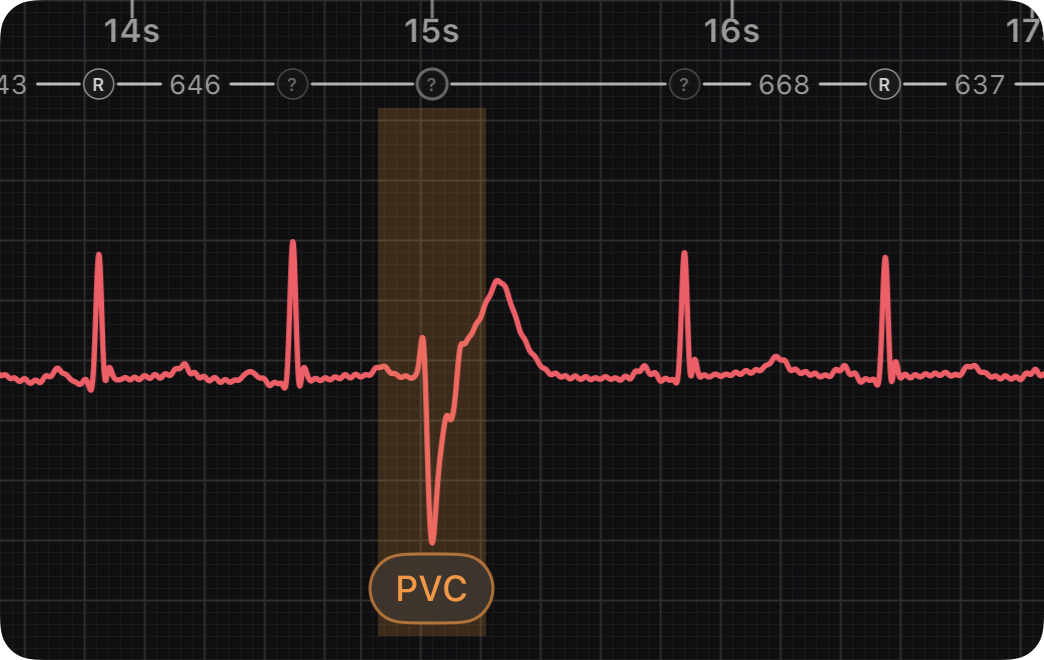
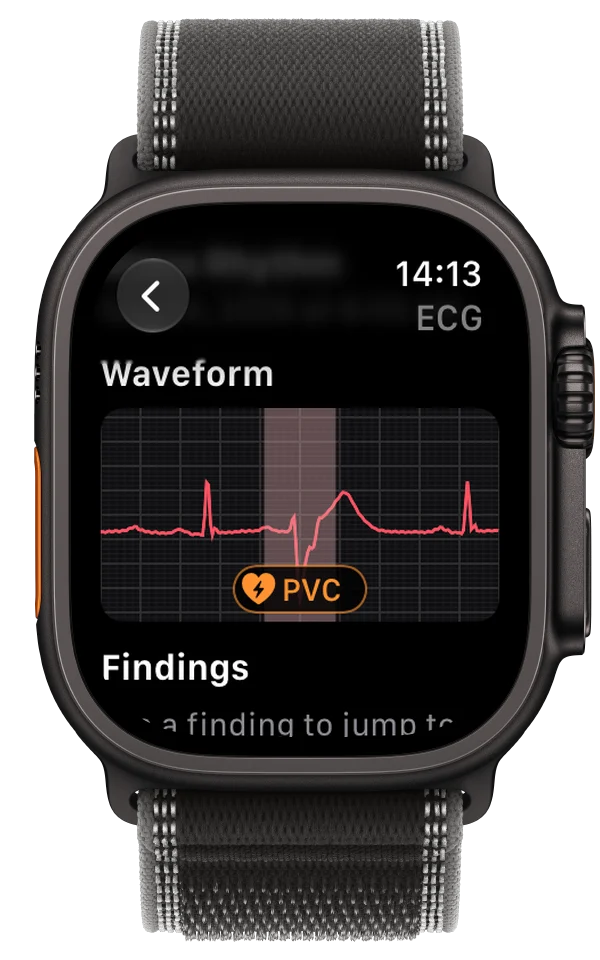
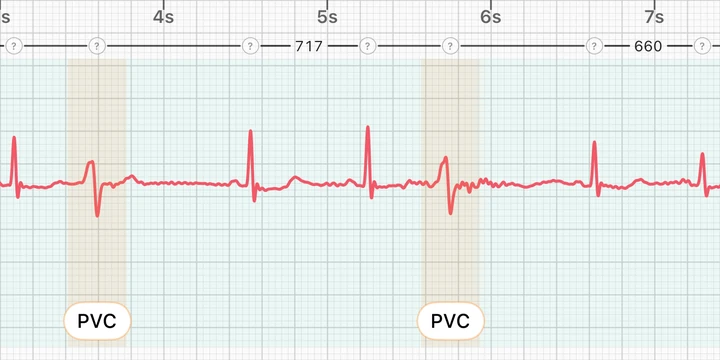
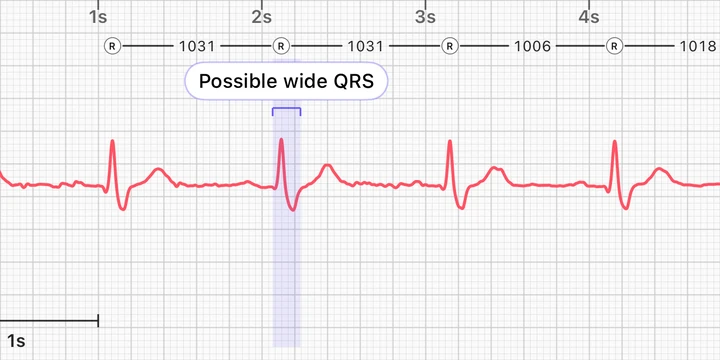
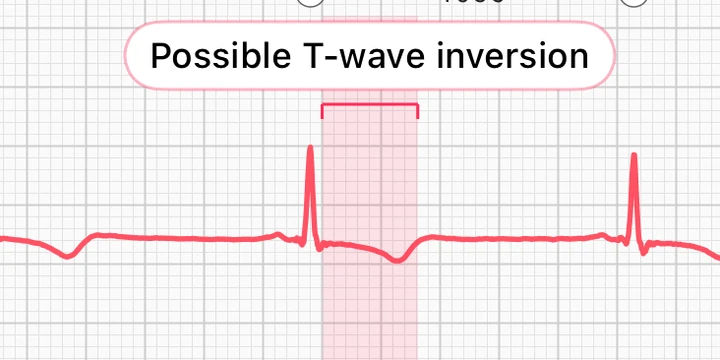
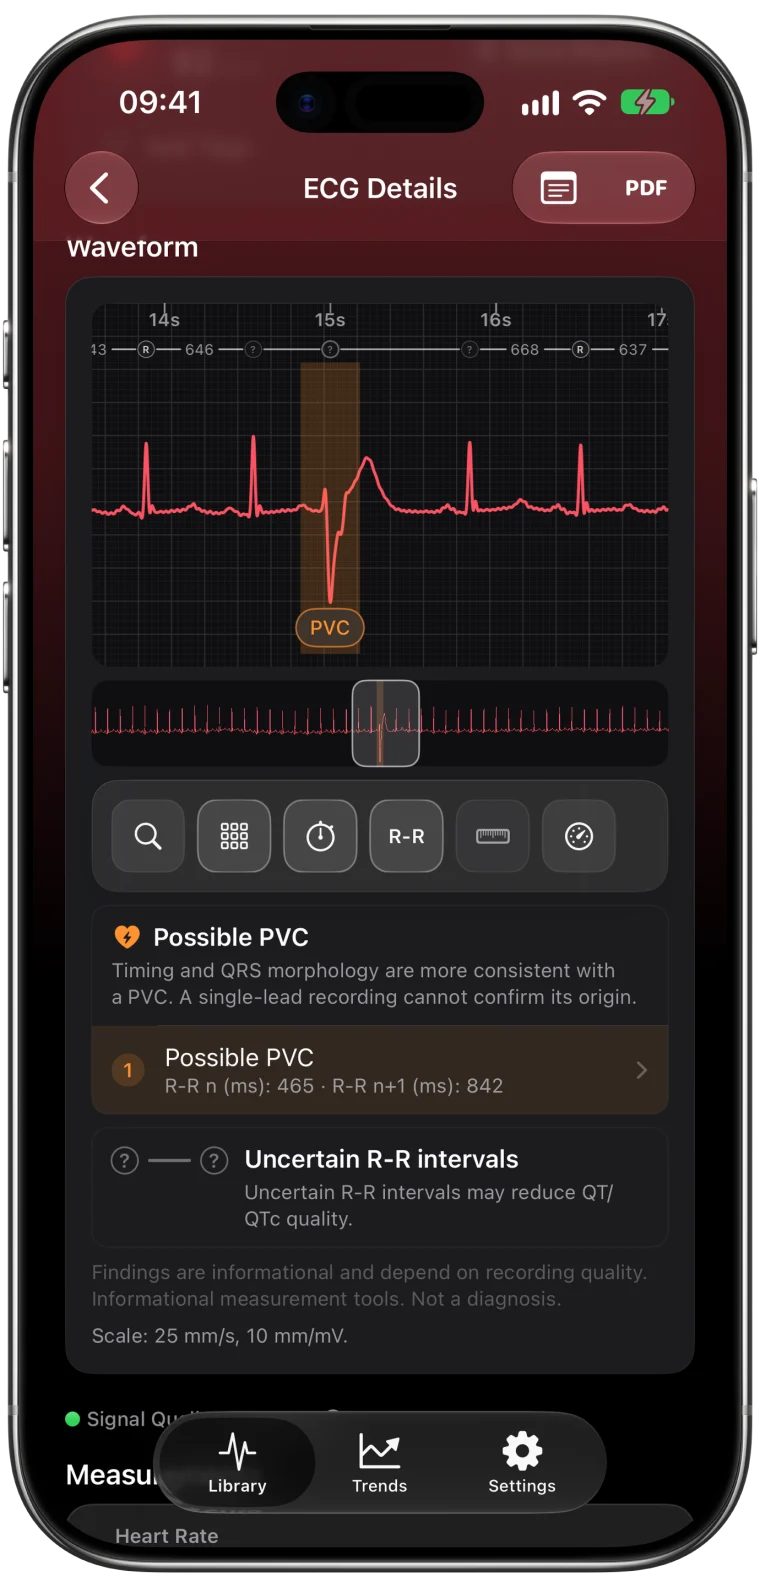
Every beat in a recording, overlaid into one representative shape. Outliers and possible premature-beat patterns stand out for review. Informational, never a diagnosis.
- All beats overlaid into one template
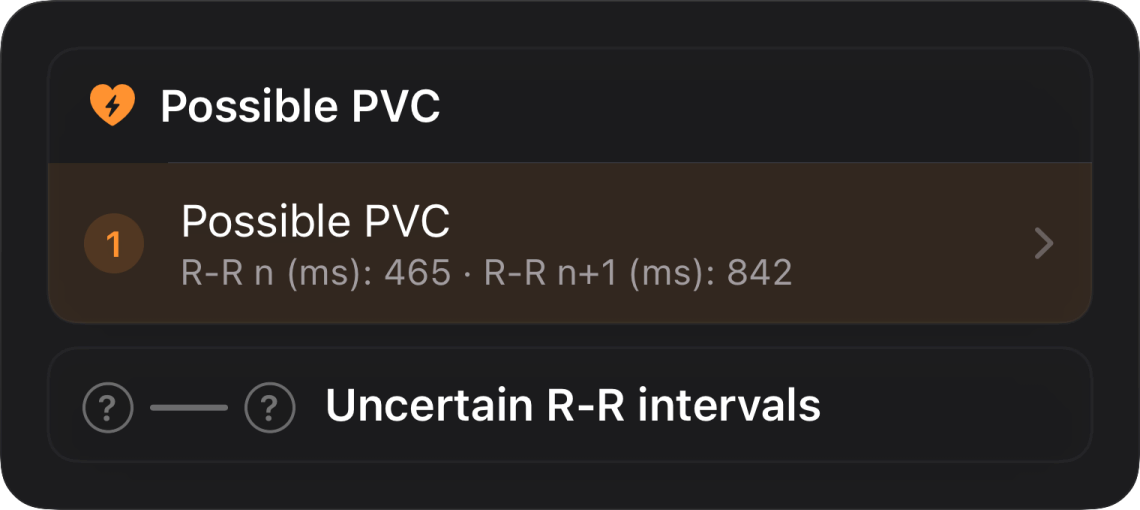
- Possible PAC / PVC patterns flagged for review
- T-wave shape and possible wide-QRS pattern notes
The real Beat Morphology screen · straight from the app
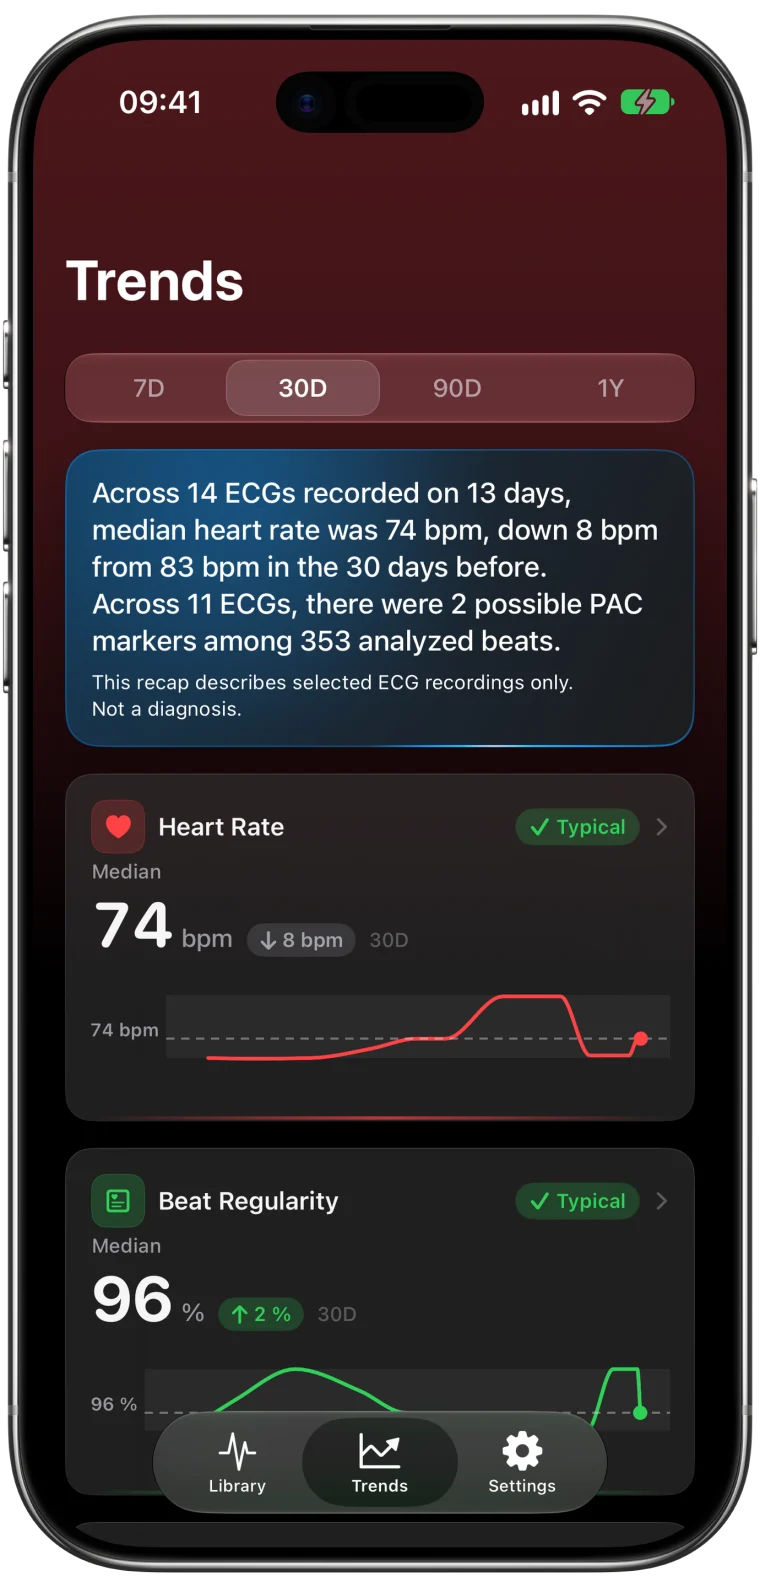
Track your changes over time.
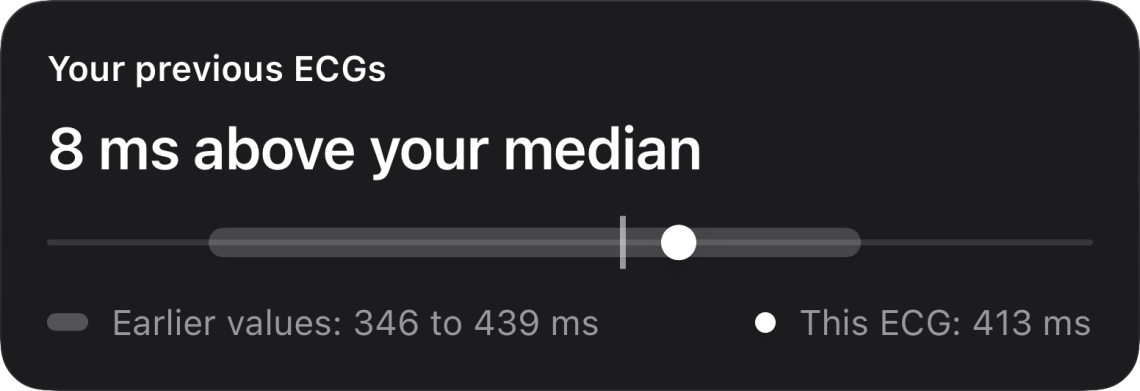
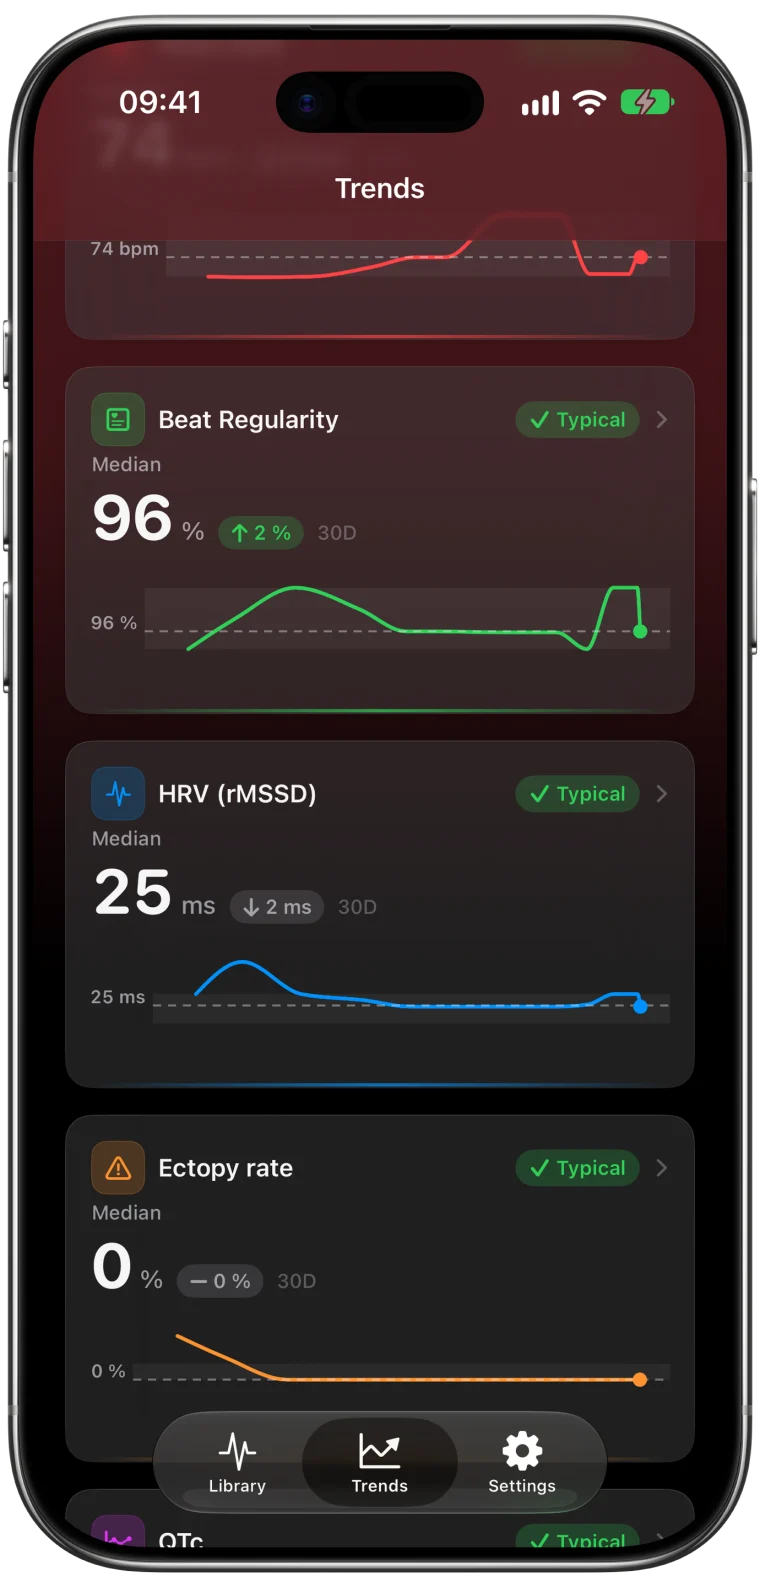
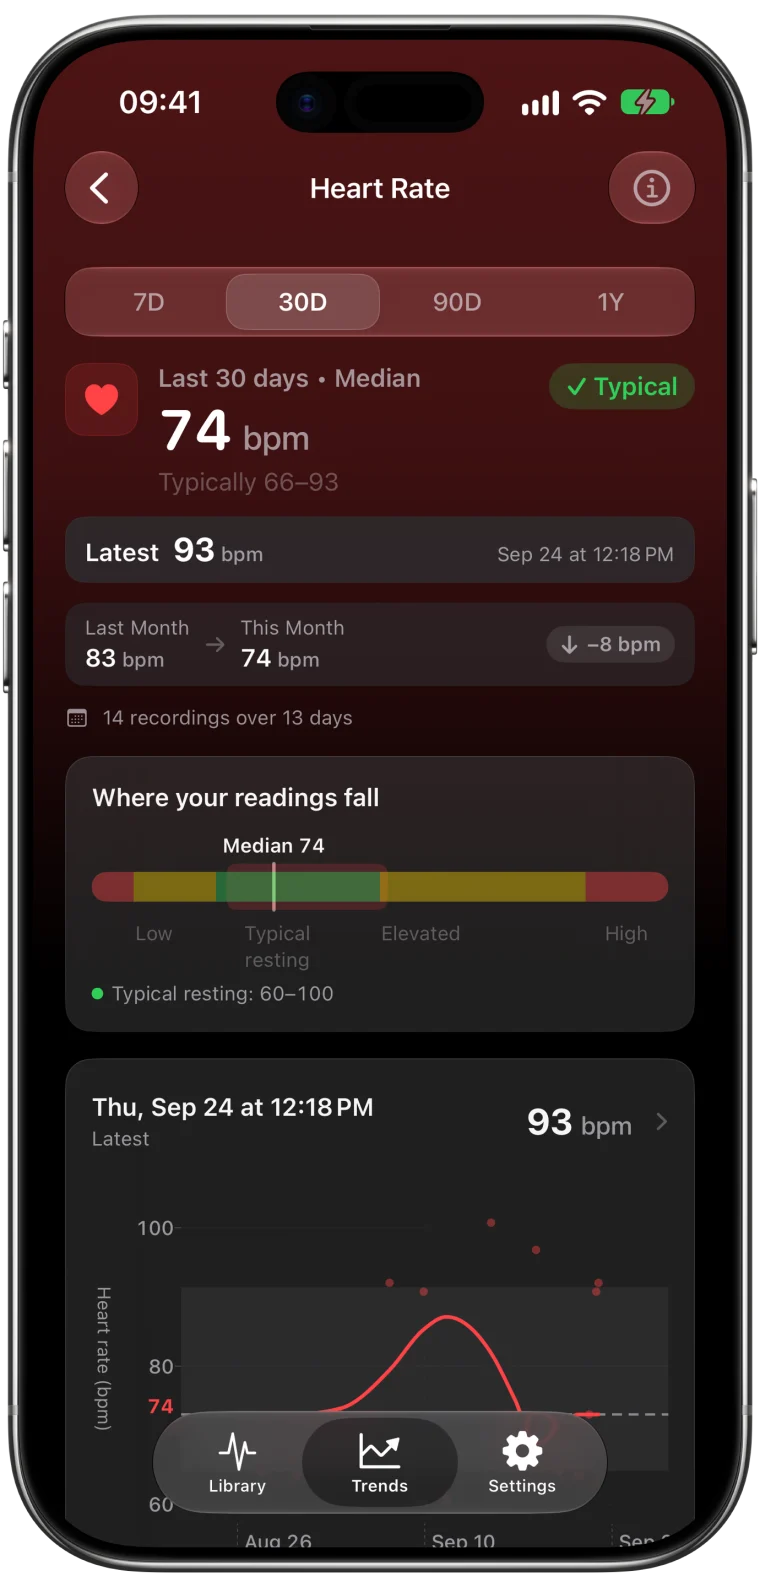
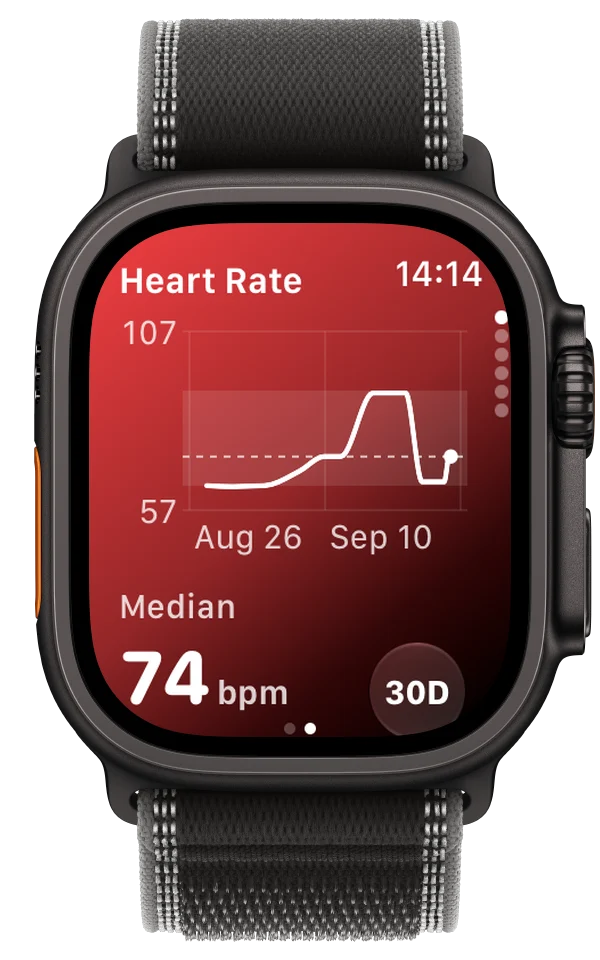
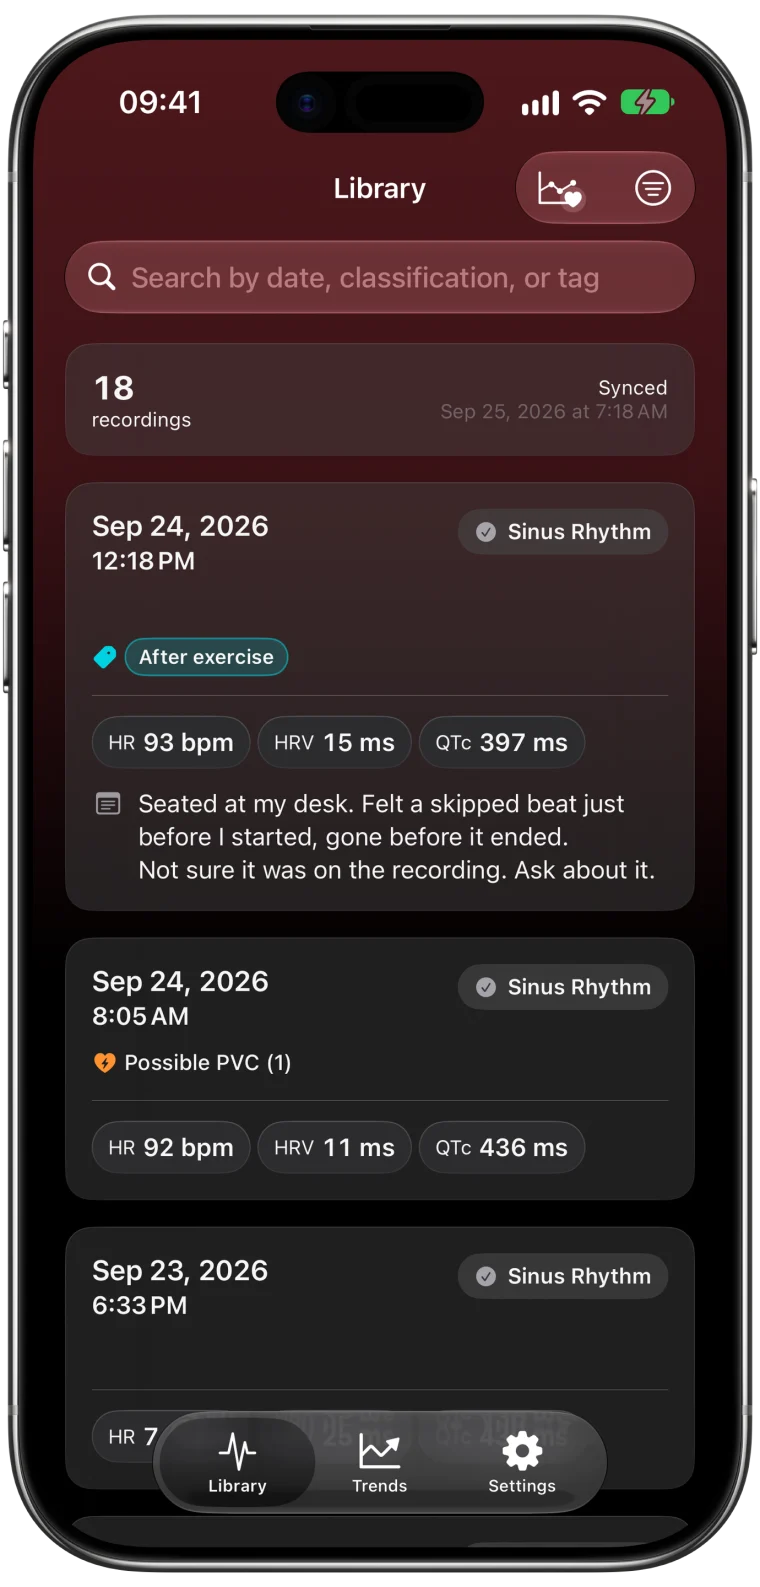
App-generated heart rate, HRV, QTc and beat-regularity values, charted from one week to one year. Each range includes a plain summary of how those estimates changed.
- App-generated heart rate, HRV, QTc and beat-regularity values over time
- Seven-day, 30-day, 90-day and one-year views
- A plain summary of how the app's estimates changed
Real Trends screens · straight from the app