You do not need medical training to understand the basics of your own ECG. Clinicians learn to read ECGs with a simple routine that works on any strip, including a 30-second recording from your wrist. This guide walks through that routine using real screens from ECG Tracker+ with demonstration data.
The parts of one heartbeat
Each heartbeat is an electrical wave that travels through the heart in a set order. On the ECG it draws the same shape again and again.1
| Part | What happens in the heart | What it looks like |
|---|---|---|
| P wave | The upper chambers (atria) are activated | A small, rounded bump |
| PR interval | The signal passes from the atria to the ventricles | The gap from the start of P to the start of QRS |
| QRS complex | The lower chambers (ventricles) are activated | A tall, narrow spike |
| T wave | The ventricles recover for the next beat | A broader, rounded bump |
| QT interval | Ventricular activation and recovery | From the start of QRS to the end of T |
An Apple Watch ECG is similar to lead I.2 On a typical lead I recording, the QRS points up and the P and T waves are smaller.
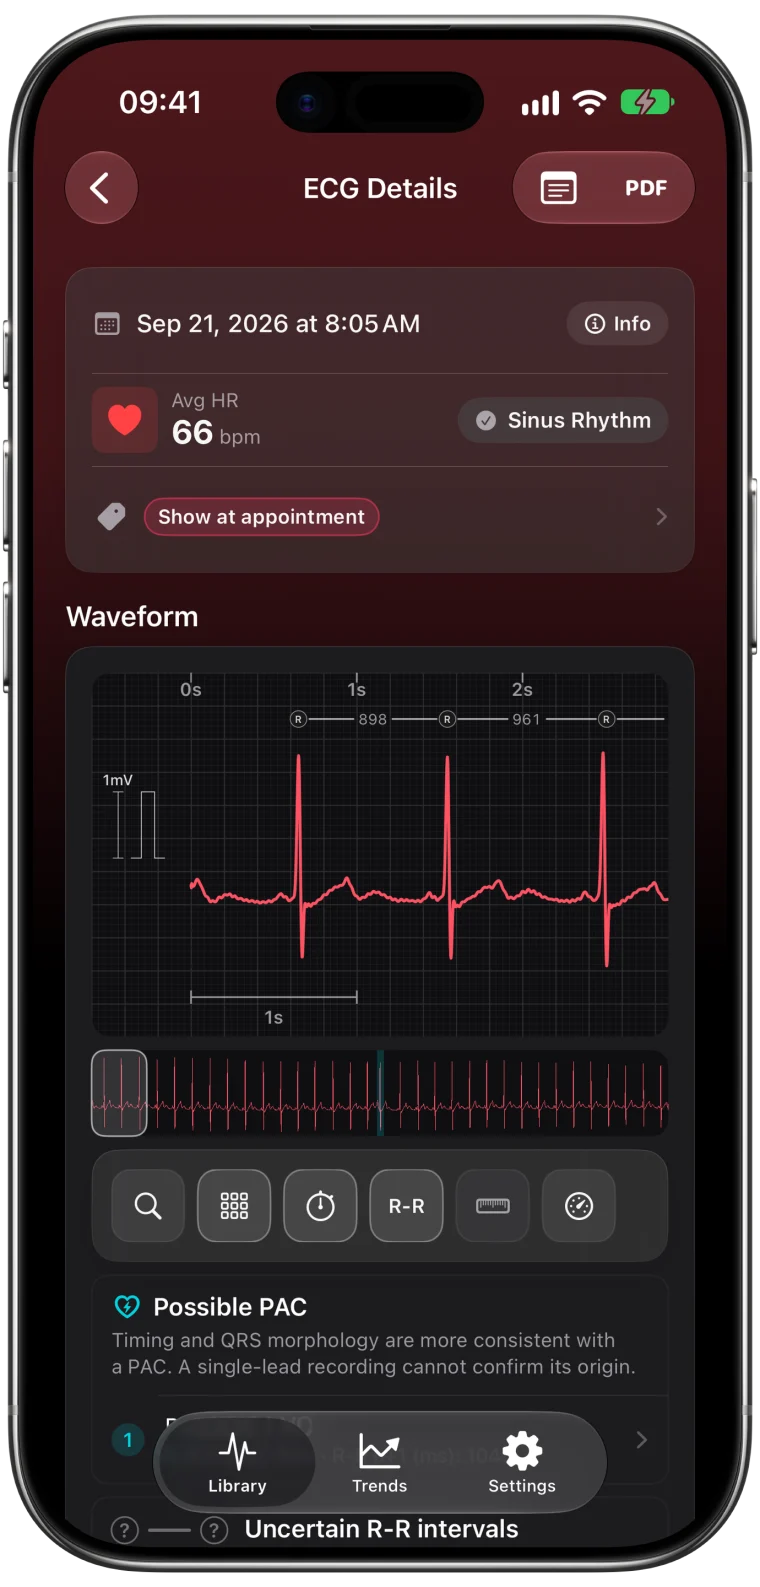
Step 1: Check the heart rate
Heart rate is the number of beats per minute. Apple shows the average for the recording, and ECG Tracker+ adds the range of rates during the 30 seconds. For adults at rest, 60 to 100 bpm is the conventional range, and athletes are often lower.3
To estimate heart rate from the grid, count the large boxes between two QRS spikes and divide 300 by that number. The grid guide shows how.
Step 2: Look at the spacing between beats
The time between two QRS spikes is the R-R interval. In a regular rhythm the spacing is nearly even, with small variations as you breathe. An early beat followed by a longer pause stands out as an interruption in the pattern. Completely irregular spacing with no pattern is what Apple's ECG app looks for when it checks for AFib.4
ECG Tracker+ shows the R-R interval between each pair of beats above the waveform, so you can see the spacing in milliseconds instead of estimating by eye.
Step 3: Check that each beat has all its parts
In a typical rhythm, every QRS has a P wave before it and a T wave after it. Look along the strip for:
- A missing P wave. No organized P waves is typical of AFib, though small P waves can also hide in noise.
- An early beat. A beat that arrives early, sometimes with a different shape, may be a premature beat. ECG Tracker+ marks these as possible PACs or PVCs. The PAC and PVC guide explains the difference.
- A wide or unusual QRS. A QRS that looks much broader than usual deserves a closer look. The wide QRS guide shows an example.
- A T wave pointing down. In lead I the T wave normally points up. The T-wave inversion guide explains what it can mean when it does not.
Step 4: Read the intervals
The intervals measure how long each part of the electrical cycle takes. They are shown in milliseconds.
- PR interval. Typically about 120 to 200 ms in adults. Some references use 100 ms as the lower limit.1
- QRS duration. Typically 70 to 100 ms. A QRS of 120 ms or more is considered wide.1
- QT and QTc. QT depends on heart rate, so it is corrected to QTc. The QTc guide explains the formulas and ranges.
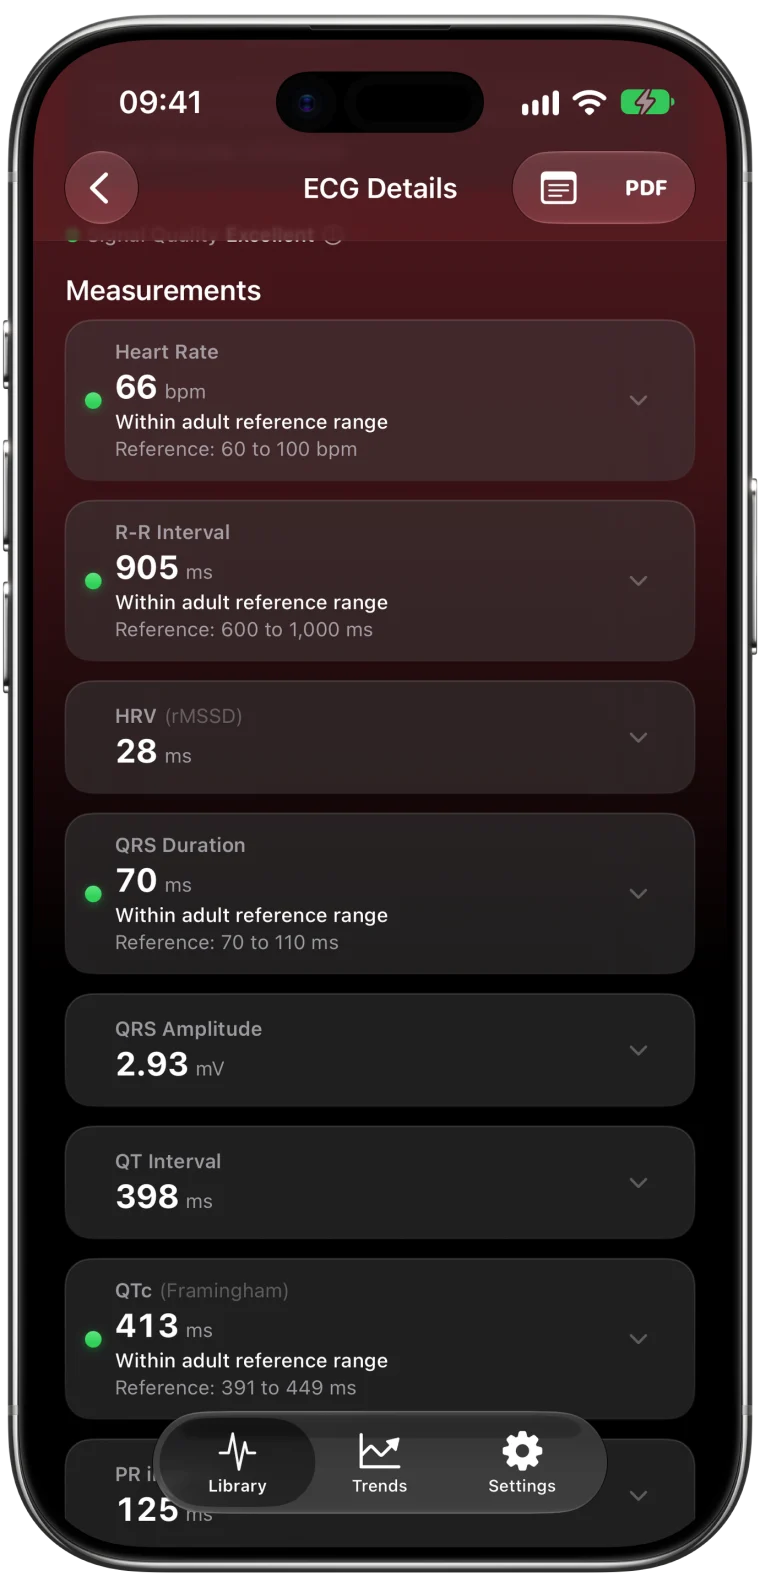
These ranges are general adult references. Individual values vary, and a value outside a range is not a diagnosis. The intervals guide goes into each one.
Step 5: Consider the recording quality
Before trusting any detail, check how clean the recording is. A flat baseline and crisp waves make measurements more dependable. Fuzz, wander or very small waves make them less certain. ECG Tracker+ shows a signal quality label for each recording.
What your reading can and cannot tell you
Reading your own ECG helps you understand your recordings and ask better questions. It cannot replace a clinician's interpretation, and a single-lead 30-second strip cannot show everything. Apple states that the ECG app cannot detect heart attacks, blood clots, strokes or many other conditions.4 The comparison with a 12-lead ECG explains why.
Chest pain, fainting or severe shortness of breath need emergency care, no matter what the strip looks like.
Frequently asked questions
Can I read my Apple Watch ECG myself?
You can learn the basics: heart rate, spacing between beats, whether each beat has a P, QRS and T wave, and the intervals between them. A clinician should interpret what the recording means for your health.
What does a normal Apple Watch ECG look like?
A typical sinus recording shows evenly spaced beats, each with a small P wave, a narrow upward QRS and a T wave, at 60 to 100 bpm at rest. Individual shapes vary from person to person.
Why does my Apple Watch ECG look different from a hospital ECG?
The Watch records a single lead, similar to lead I, while a hospital ECG shows twelve leads from different angles. Some waves look smaller or different on lead I.