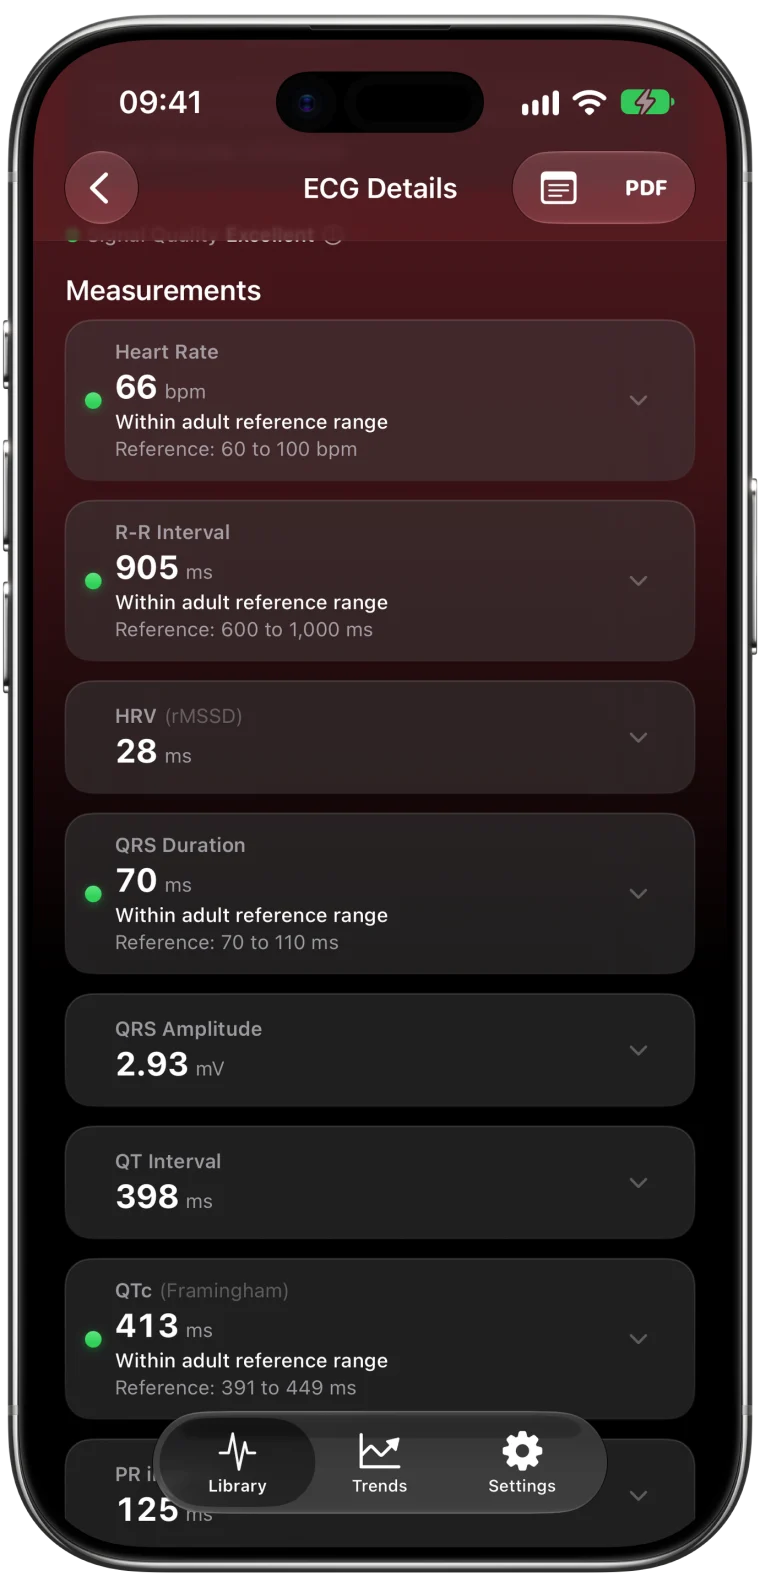
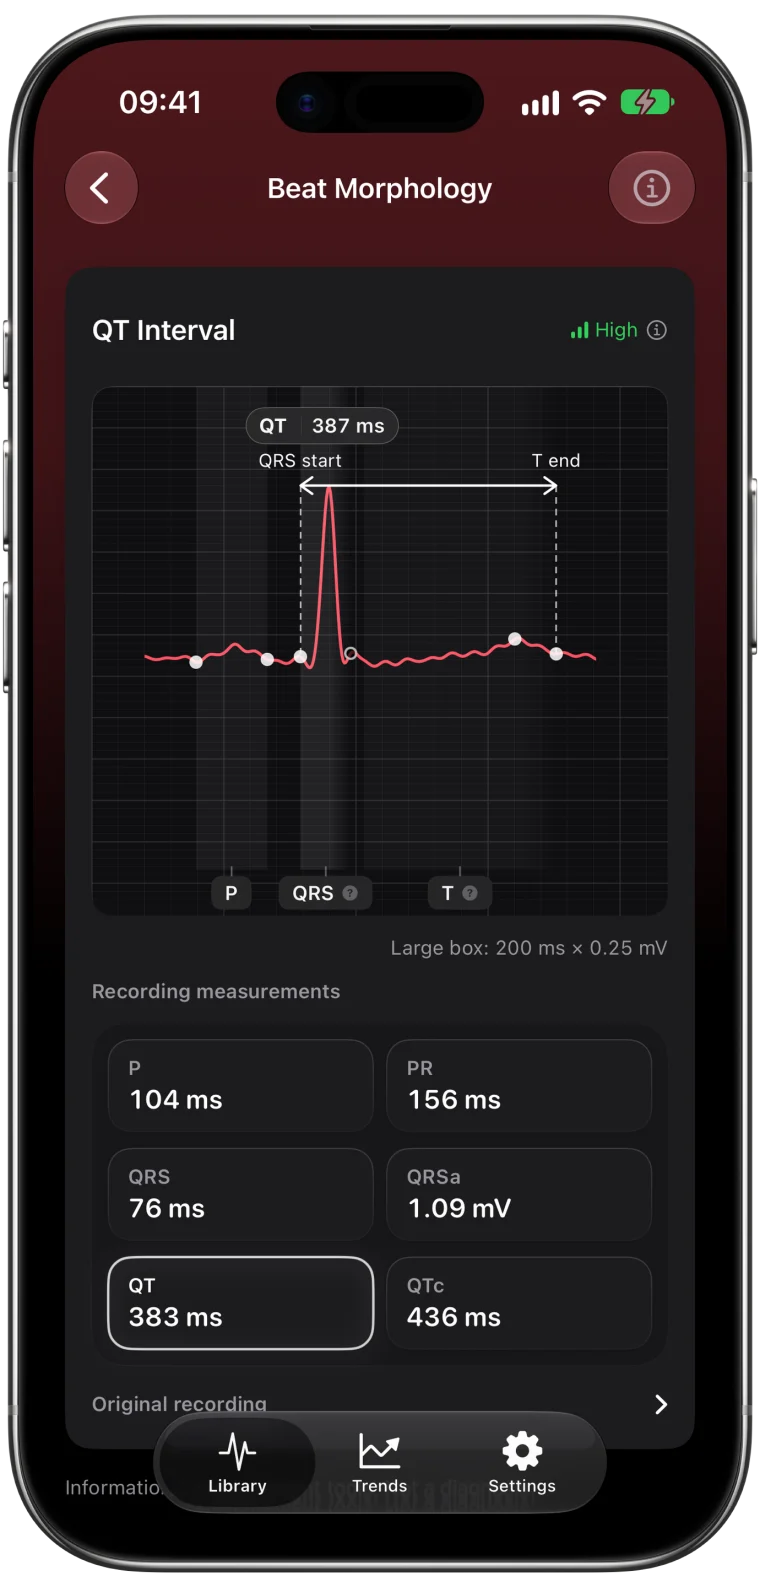
Clinicians have read ECGs on paper grids for over a century, and the grid is still the fastest way to understand timing at a glance. Once you know what the boxes mean, you can estimate a heart rate, see whether the spacing between beats is even and check a measurement for yourself.
The standard ECG grid
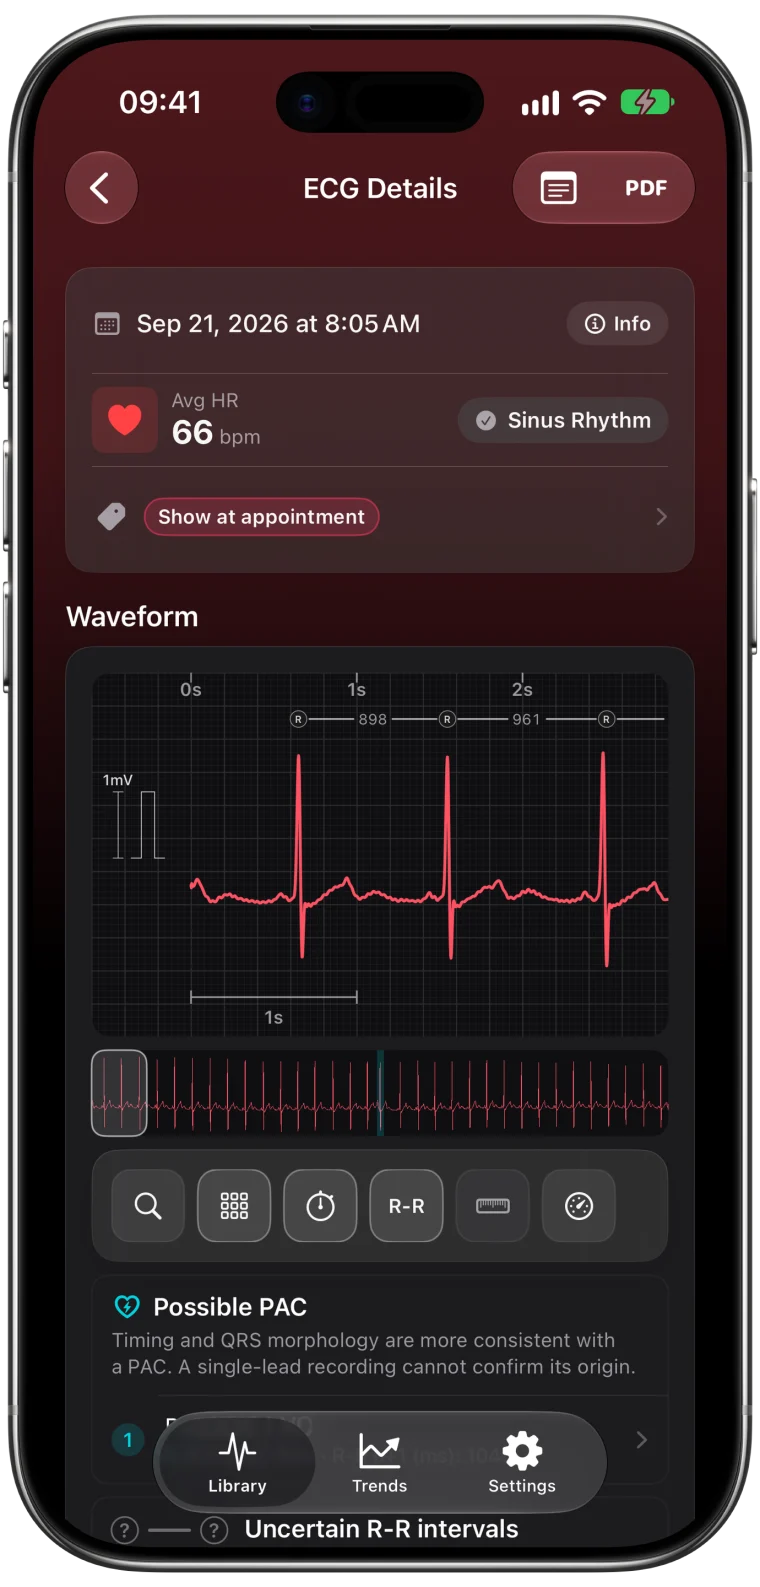
A traditional ECG grid has small boxes of 1 millimeter, grouped into large boxes of 5 millimeters. The printed trace runs at a standard speed of 25 millimeters per second.1
| On the grid | At 25 mm/s |
|---|---|
| 1 small box, horizontally | 40 ms (0.04 s) |
| 1 large box, horizontally | 200 ms (0.2 s) |
| 5 large boxes | 1 second |
| 30 seconds | 150 large boxes |
The vertical axis measures voltage. At the standard gain of 10 millimeters per millivolt, one small box is 0.1 mV and two large boxes are 1 mV.1
ECG Tracker+ shows the scale under the waveform, for example Scale: 25 mm/s, 10 mm/mV, and a 1 mV calibration pulse at the start of the strip, just like a clinical printout.
Estimate heart rate from the grid
Because 300 large boxes pass in a minute, you can estimate heart rate by counting large boxes between two R peaks and dividing 300 by that number.1
- 3 large boxes between beats: about 100 bpm
- 4 large boxes: about 75 bpm
- 5 large boxes: about 60 bpm
This quick method works best when the rhythm is regular. For an irregular rhythm, counting beats over a longer span, such as the full 30 seconds, gives a better average.
Measure timing with calipers
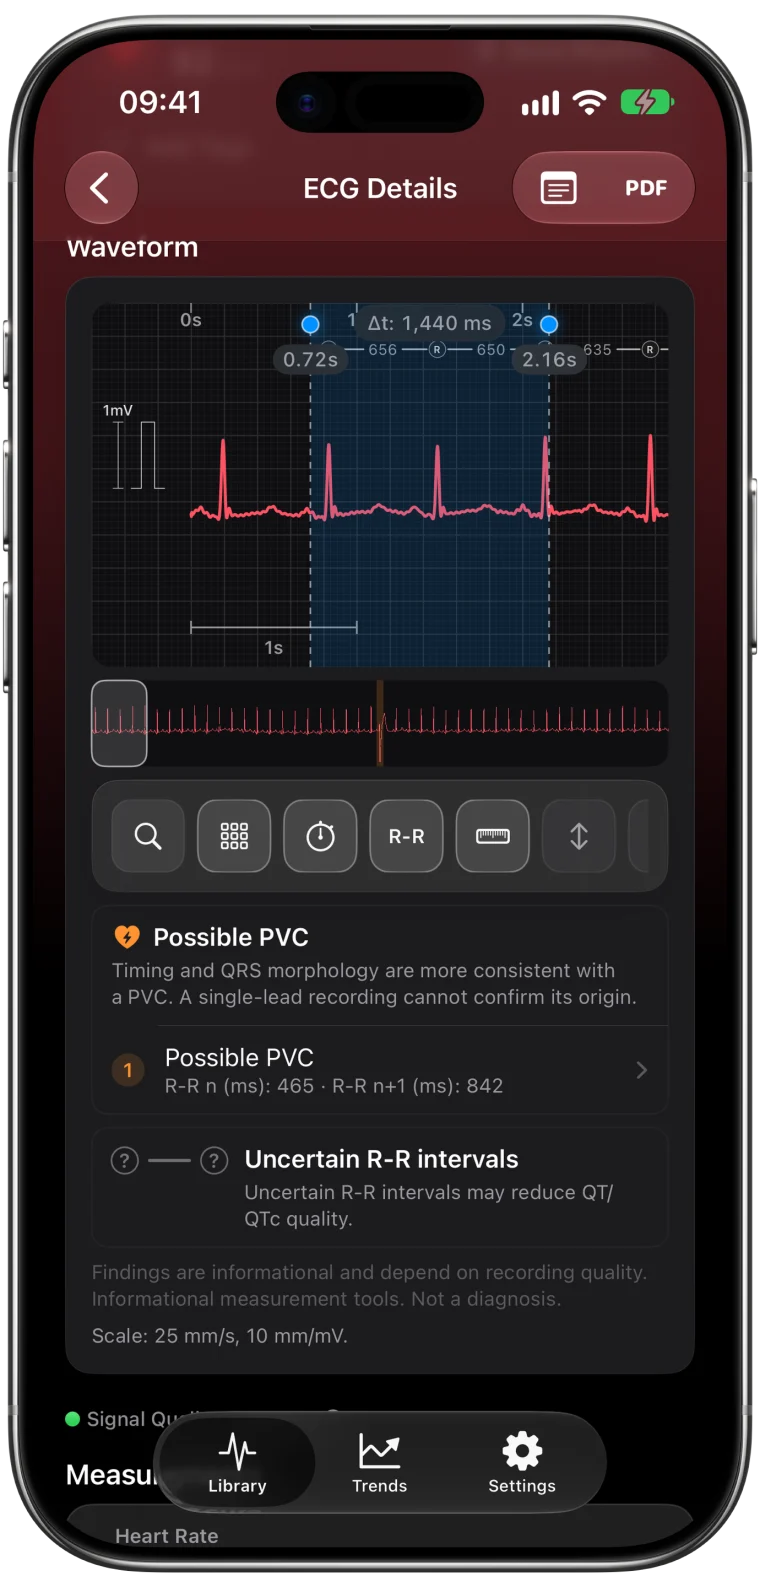
Counting boxes is great for estimates. Calipers are more precise. In ECG Tracker+, open a recording, tap the calipers button in the waveform tools and drag the two markers to the points you want to compare. The app shows the time between them.
Some useful things to try:
- One R-R interval. Place the markers on two neighboring R peaks. Dividing 60,000 by the result in milliseconds gives the instantaneous heart rate.
- Several beats. Span three or four beats to see whether the spacing is steady.
- Around a marked beat. If a beat is marked as a possible extra beat, compare the gap before it with the gap after it.
Calipers measure what you choose to measure. The app's own interval estimates are shown separately in the Measurements section, so you can compare your reading with them.
Speed and gain change the look, not the timing
You can change the display speed and gain in ECG Tracker+. A faster speed, such as 50 mm/s, stretches the trace horizontally so each box represents less time. A higher gain makes waves taller. The underlying recording does not change, and the scale label always tells you which settings are active.
If you compare your screen with a printed ECG, check that both use the same speed and gain first. Otherwise the same heartbeat will look wider or taller on one of them.
Frequently asked questions
How many milliseconds is one small box on an ECG?
At the standard 25 mm/s, one small box is 40 milliseconds and one large box is 200 milliseconds.
What does 10 mm/mV mean on an ECG?
It is the gain, or vertical scale. At 10 mm/mV, a 1 millivolt signal is drawn 10 millimeters tall, which is two large boxes.
Can I measure QT myself with calipers?
You can place calipers from the start of the QRS to the end of the T wave to see the span. The end of the T wave is often gradual, so different readers may place it differently. The app shows its own QT estimate separately in Measurements.