One ECG is a 30-second snapshot. Twenty of them, spread over a month, start to show what is typical for you. That is what Trends is for. It turns a list of recordings into a picture of how your measurements move, and it always lets you open the ECG behind any point.
What Trends shows
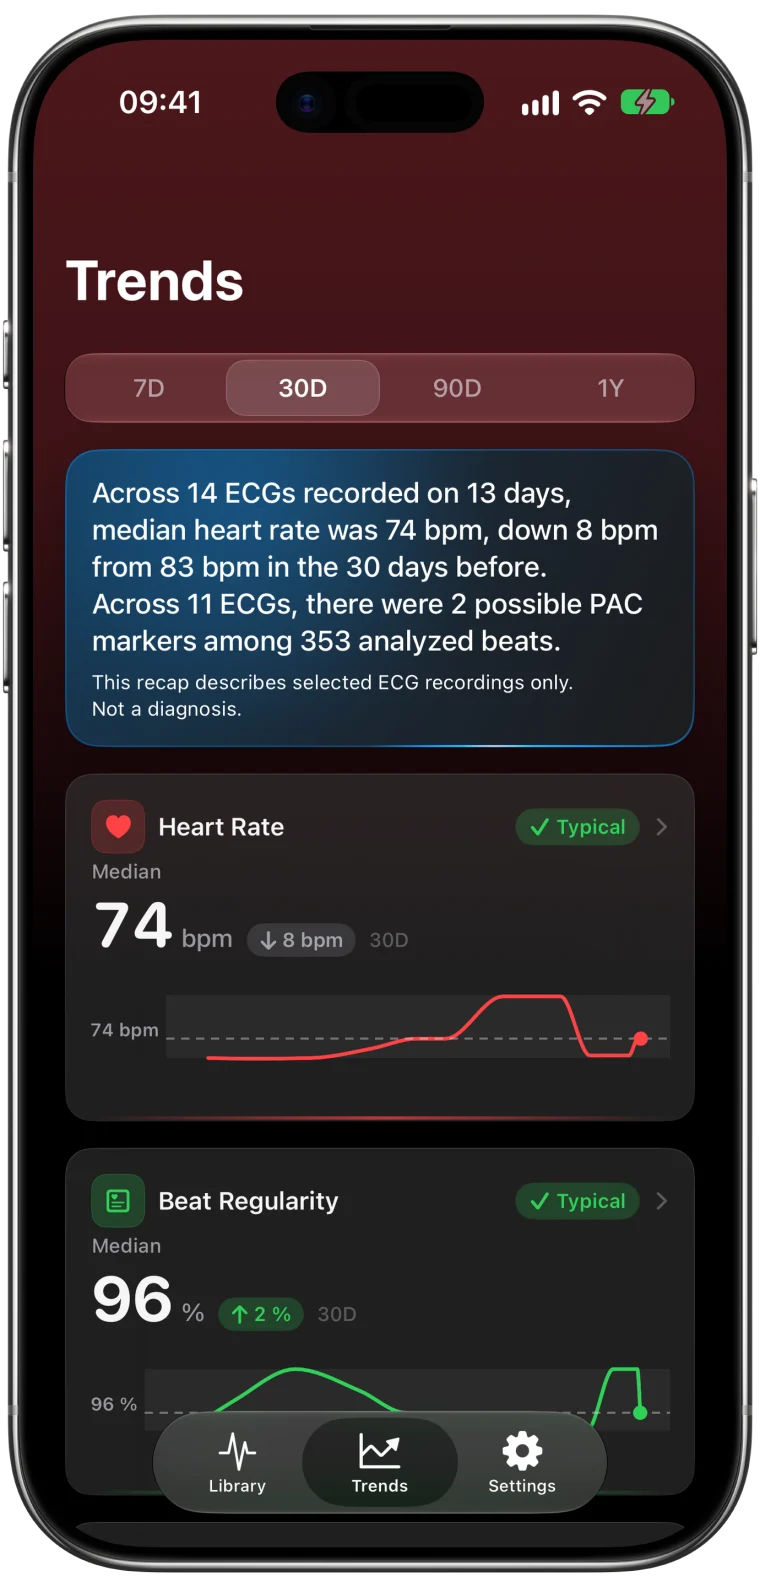
Trends summarizes the measurements from your saved ECGs. For each period you choose, you see cards for:
- Heart rate from your recordings
- Beat regularity, how even the spacing between beats was
- HRV (rMSSD), beat-to-beat variability from each 30-second recording
- Ectopy rate, how often possible extra beats were marked
- Reading quality, how usable the recordings were
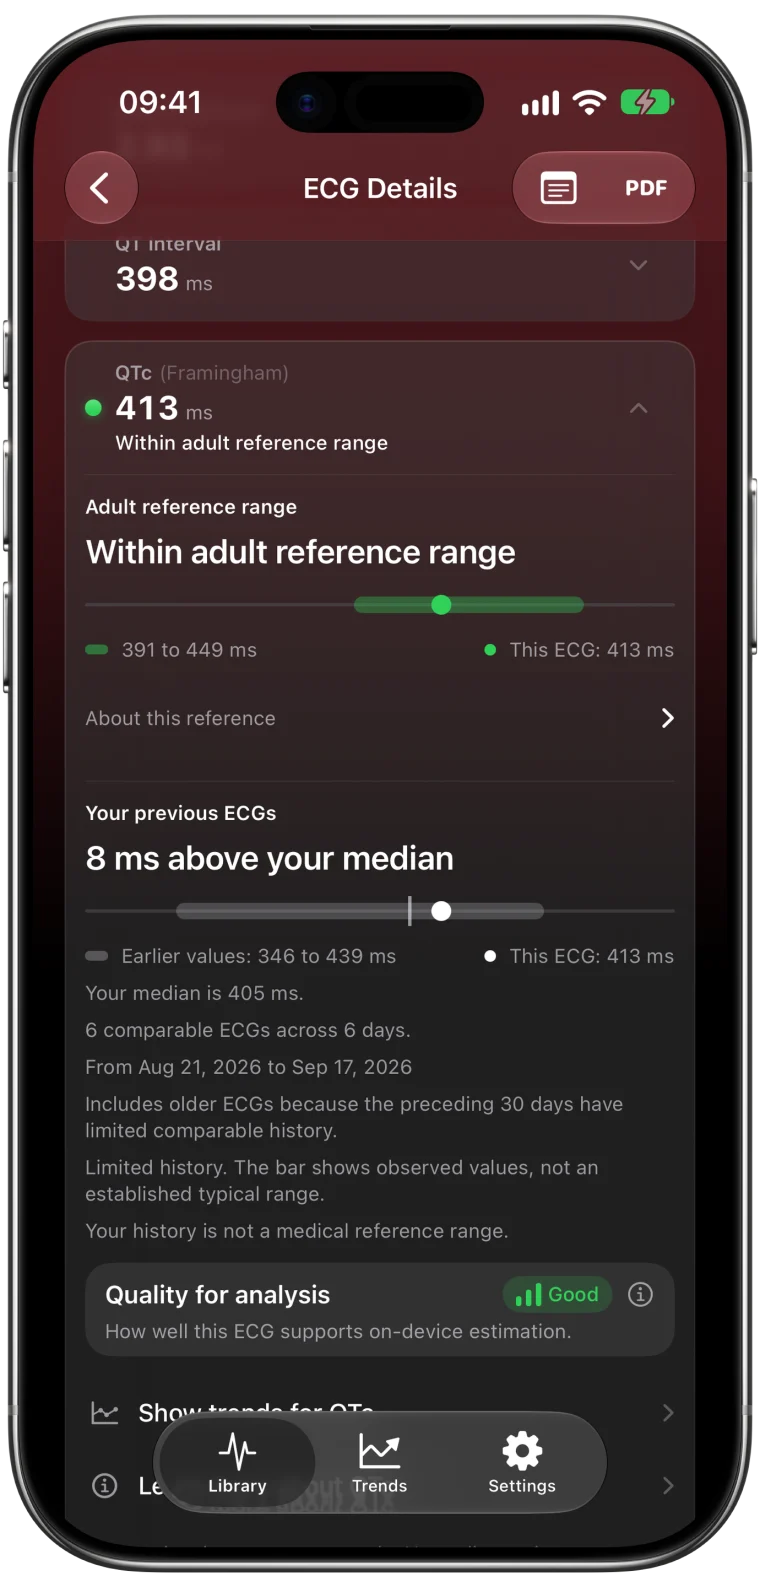
- QTc, your corrected QT estimates
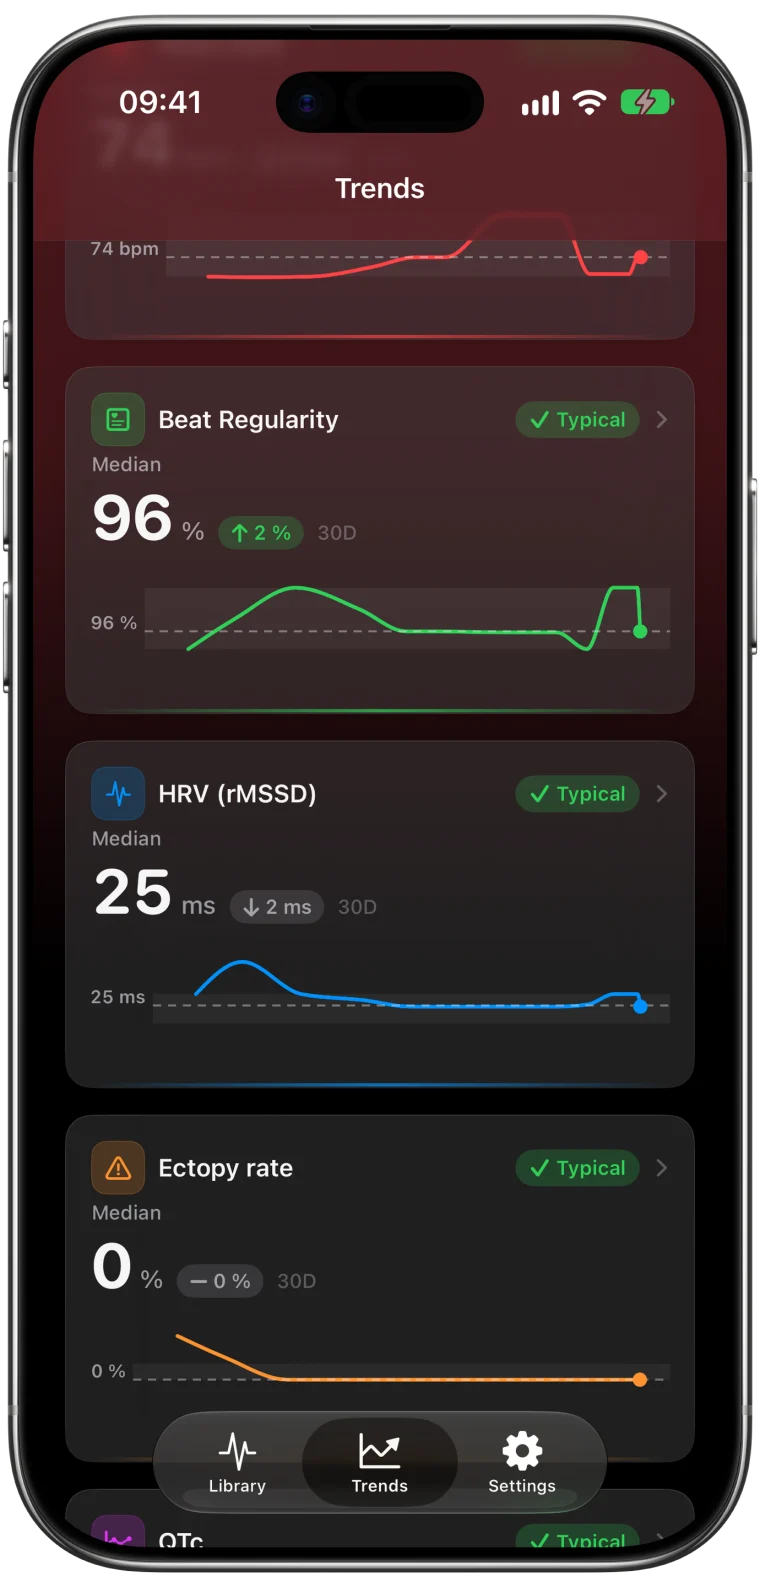
Choose 7D, 30D, 90D or 1Y at the top to change the period. The free plan shows heart rate and beat regularity for the last 7 days. Pro adds every card and the longer periods.
Median, latest and change
Each card leads with the median, the middle value when the recordings in the period are lined up from lowest to highest. The median is a good description of what is typical because one unusual recording barely moves it.
Here is a fictional example. Five heart rates of 60, 62, 64, 66 and 90 bpm have a median of 64 bpm, even though one recording was much higher. If the 90 bpm recording was the newest, the latest value is 90 bpm. Both are correct. They answer different questions.
Next to the median you see the change from the previous period of the same length, such as "↓ 8 bpm" compared with the 30 days before.
The recap, in plain words
At the top of Trends, a short recap describes the period in sentences. For example: "Across 14 ECGs recorded on 13 days, median heart rate was 74 bpm, down 8 bpm from the 30 days before." It also mentions any possible extra beats that were marked, and how many analyzed beats they were found among.
The recap describes only the ECGs you recorded. It does not describe what your heart did between recordings.
Open the recording behind any point
A trend is only as useful as the recordings behind it. Tap a card to open the detailed view, then touch the chart to select a point and tap it to open that ECG. You can also expand Readings to browse every recording in the period.
Looking at the actual recording often explains a surprising value. A heart rate of 110 bpm may turn out to be the ECG you took right after climbing stairs. A note on the recording can remind you.
Read a change with care
A numerical change in Trends is real in the sense that the recordings differ. What it does not tell you is why. Before drawing conclusions, ask:
- How many recordings are in each period? Three ECGs make a much less stable median than twenty.
- When were they recorded? Morning recordings at rest and evening recordings after exercise are not directly comparable.
- Same method? A different QTc formula or a manual adjustment changes the numbers.
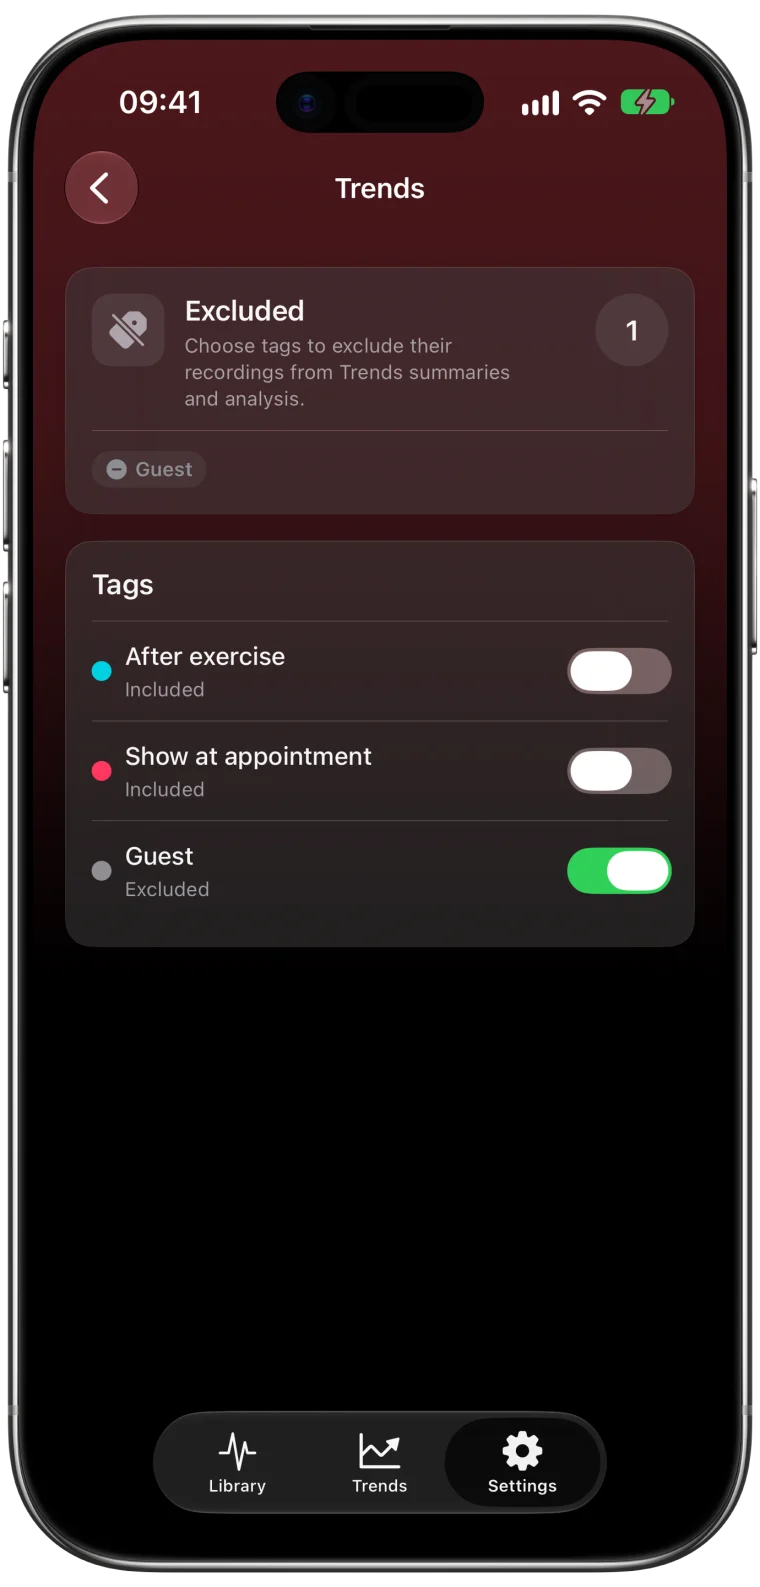
- Whose recordings? An ECG taken by someone else on your Watch can shift your summary. The guide to excluding another person's ECG shows how to leave it out.
Recording under similar conditions, for example seated after a few minutes of rest, makes your Trends far more meaningful.
Missing values are not zeros
If a recording has no value for a measurement, it is simply left out of that card. It does not count as zero, so it cannot pull a median down. This is why the QTc card may show fewer points than the heart rate card. The measurement availability guide explains why some values are missing.
A change in your Trends is information to notice and, if it concerns you, to discuss with a clinician. It is not a diagnosis, and a steady trend does not rule out a problem.
Frequently asked questions
Why does the median differ between the recap and a Trends card?
They can summarize the same period in slightly different ways, so their numbers can differ a little. Open the detailed card to see every recording that contributes.
How many ECGs do I need for Trends to be useful?
There is no fixed number, but more recordings under similar conditions give steadier medians. A handful per week over several weeks is a good start.
Does Trends use my Apple Health heart rate data?
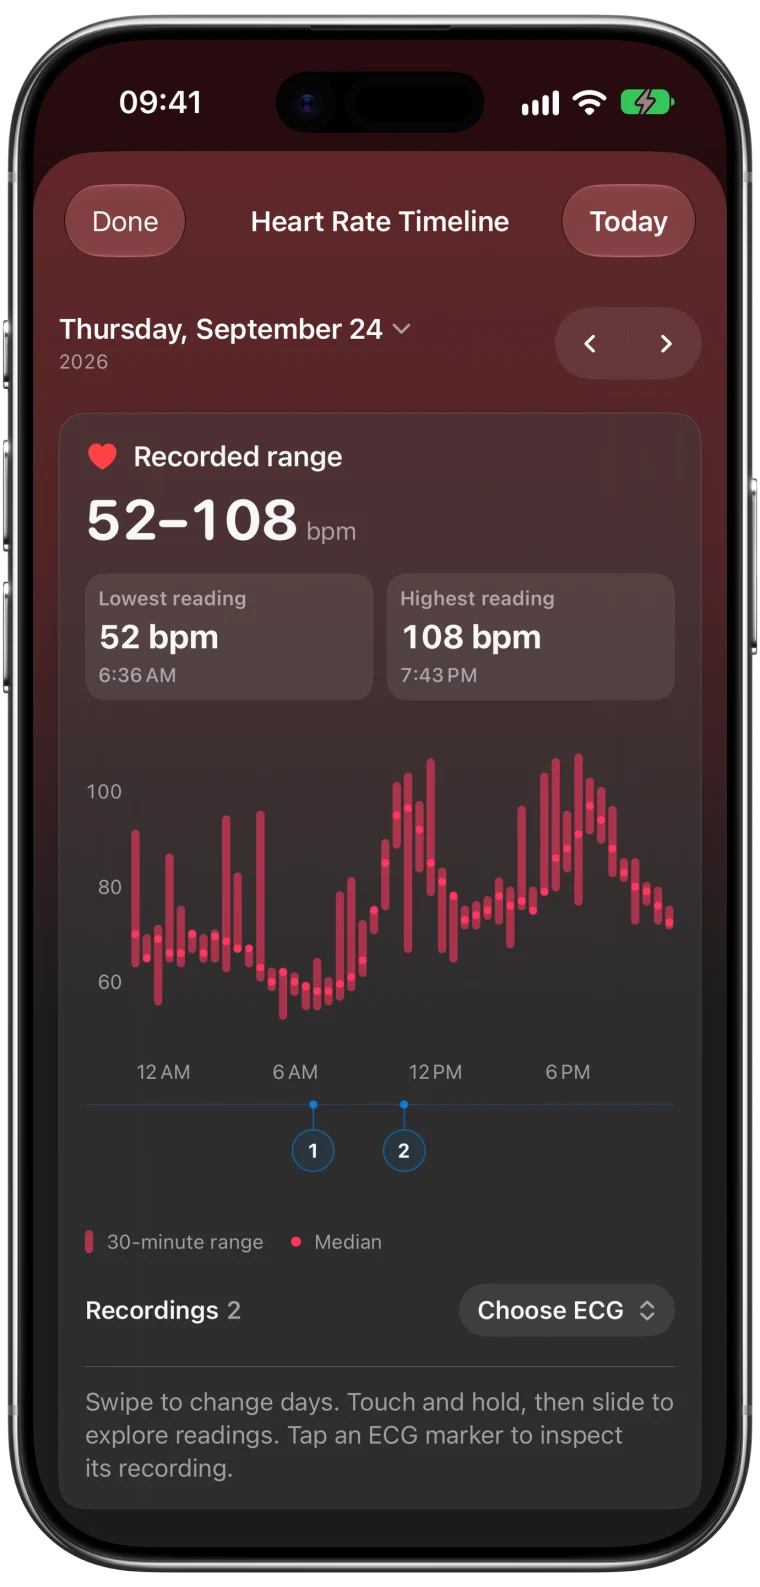
Trends summarize measurements from your ECG recordings. Heart rate readings from the optical sensor appear separately in the Heart Rate Timeline.